
Wall Street dropped for the third day in a row despite yet more strong economic and pandemic data with USD finally pulling back after its week long trend upwards. 10 year Treasury yields remain elevated at year highs, pushing through the 1.3% level at one stage while commodities were mixed as copper continued its own uptrend as oil took a minor breather with Brent and WTI crude falling back about 1% or so.
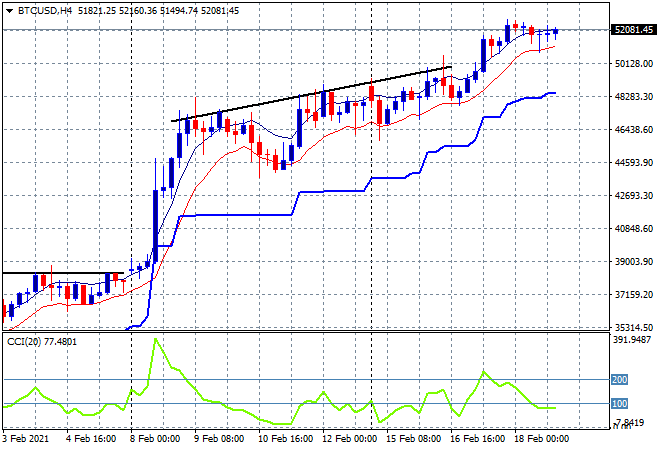
Having broken through the magical $50K level, Bitcoin remains elevated above the $52K level this morning without a new daily high. Everything remains awesome as seen on the four hourly chart below, having more than doubled since Christmas with trailing ATR support at the $48K level the uncle point to watch:
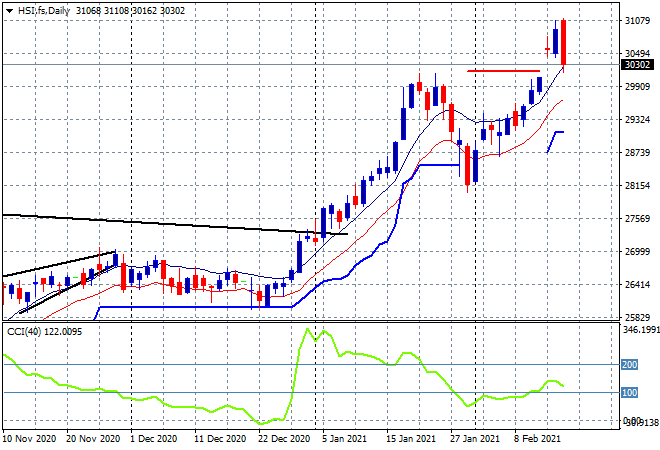
Looking at share markets in Asia from yesterday’s session where the Shanghai Composite returned from the Chinese NY holiday, eventually closing 0.5% higher at 3675 points while the Hang Seng Index finally pulled back, down over 1.5% to close at 30599 points. My expectations of a minor pullback to the 30000 point level are coming to fruition here, but its not that surprising given the overblown nature of the market. This level should act as support going forward for another upleg:
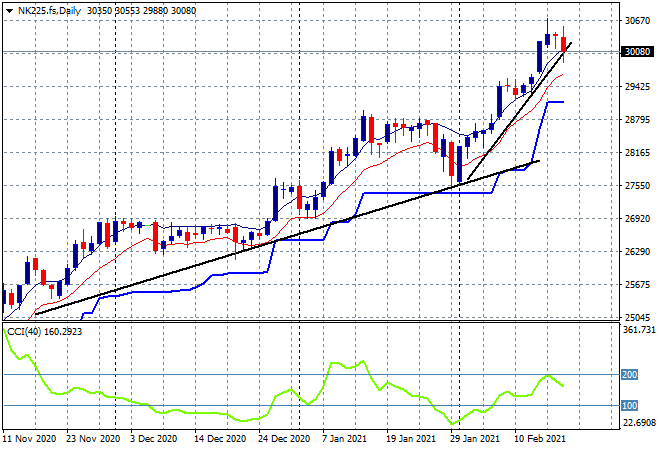
Meanwhile Japanese markets also remain in pullback mode, with the Nikkei 225 finishing 0.2% lower at 30233 points. Futures are unstable so far due to the Wall Street stumble and while daily ATR support continues to firm higher, that trendline in recent weeks is now under threat, so I would expect price to hover above or slightly break below shortly:
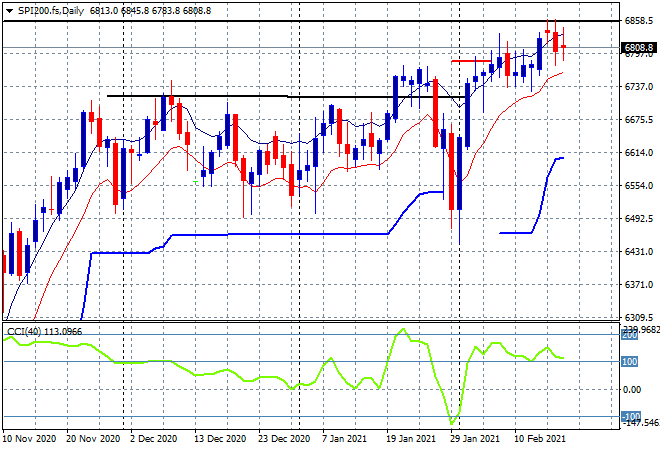
The ASX200 returned a scratch session with a thirty point trading range ending up finishing only a point higher at 6886 points. SPI futures are down over 30 points or more than 0.5% again due to the wavering confidence on Wall Street, so I continue to watch the low moving average carefully and any signs of a momentum crossover on profit taking:
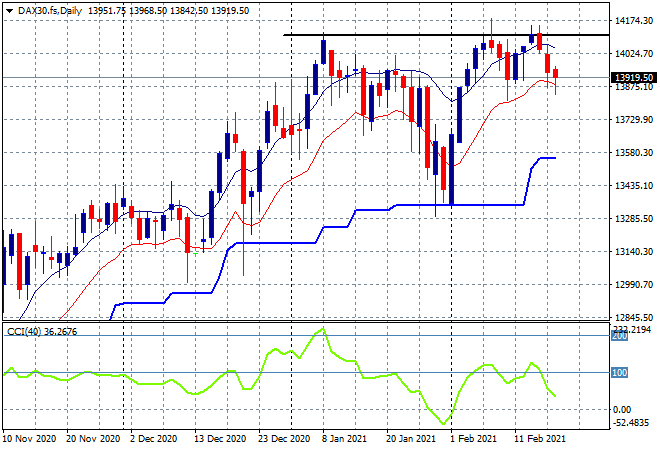
European markets had losses again across the continent, although the FTSE did most of the dropping, falling 1.6% as the German DAX did the relative best, only slipping 0.2% to remain below the 14000 point level again at 13886 points. Price just can’t back above that level as those former highs in early January continue to firm as strong resistance, so again another market I’m looking at closely for signs of a rollover:
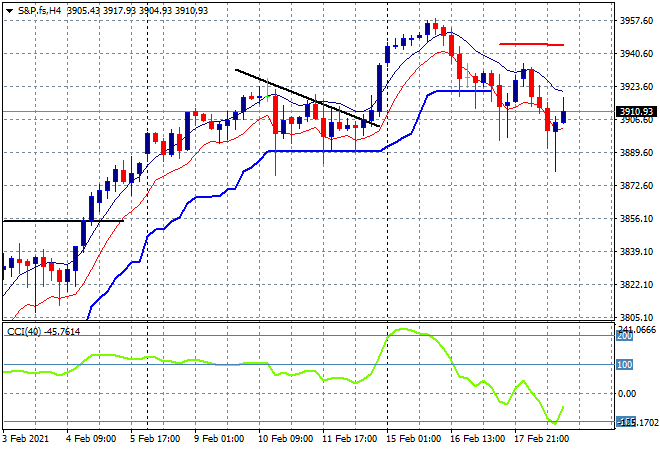
Wall Street was this time united in their pullback from the Dow to the NASDAQ to the S&P500, the latter closing 0.4% lower to 3919 points. The four hourly chart shows price pulling back directly to the 3900 point level but those recent long tails of intrasession buying support were not enough to stave off a dip below the 3900 point level proper. Are we seeing the first stage of a bust here?
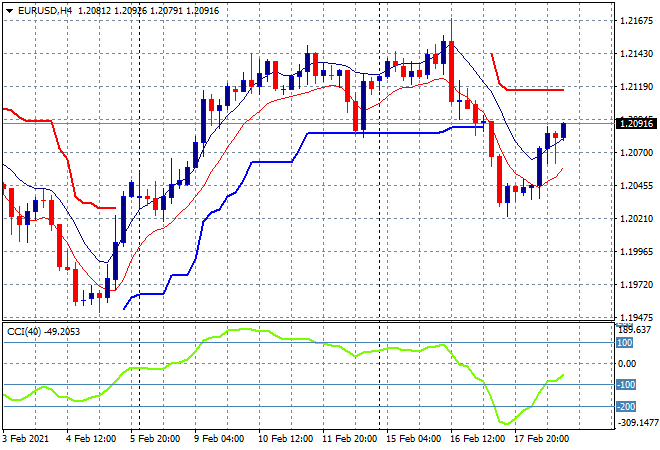
Currency markets reversed overnight on the USD bulls caved in temporarily, sending Euro almost back above the 1.21 handle. This firm bounce takes price back up to former trailing ATR support on the four hourly chart at the 1.2080 level and is so far only a swing position, given that while momentum was considerably oversold it has not yet crossed into positive territory:
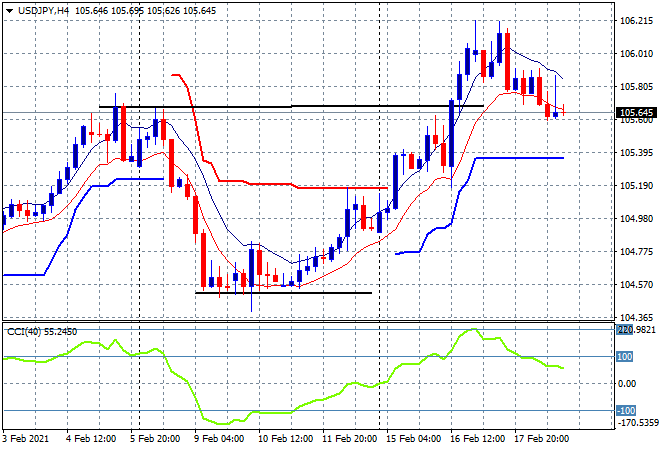
After oscillating around its recent breakout, the USDJPY pair has extended its pullback due to the overall USD weakness to well below the 106 handle. Short term momentum was considerably overbought on the four hourly chart so this is an inverse to the Euro chart above, but I still expect overall USD strength to keep it steady here or perhaps down to the point of control at the 105.30 level:
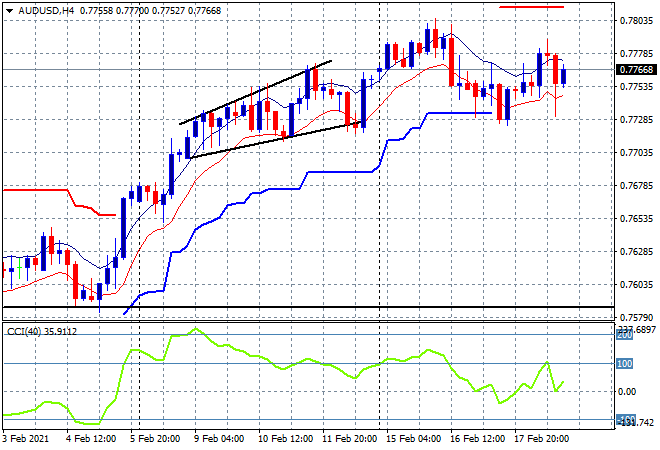
The Australian dollar remains the enigma, pretty much unchanged and still hovering between the 77.30 and 77.90 level all week despite a lot of economic catalysts. Yesterday’s numberwang aka unemployment print was a non-even, so the only area to watch here is a potential breakout above the 77.80 level on continued USD weakness:
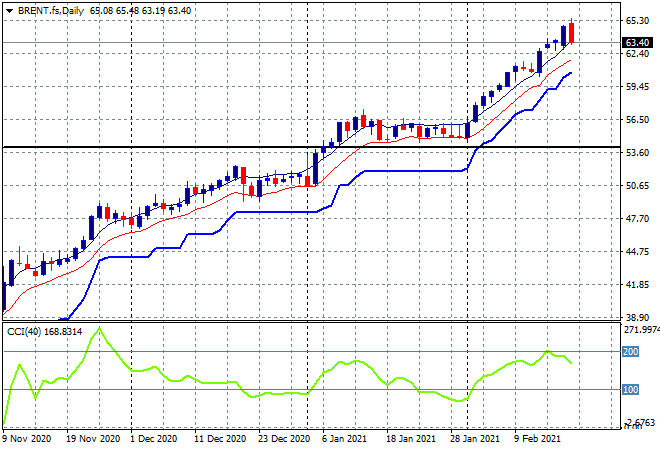
Oil prices came back slightly with Brent crude pulling back below the $64USD per barrel level overnight. This maybe the first sign of trouble in reaching the upside target at the $70USD per barrel at the 2019 highs remains intact, as daily momentum readings were getting a little too overextended:
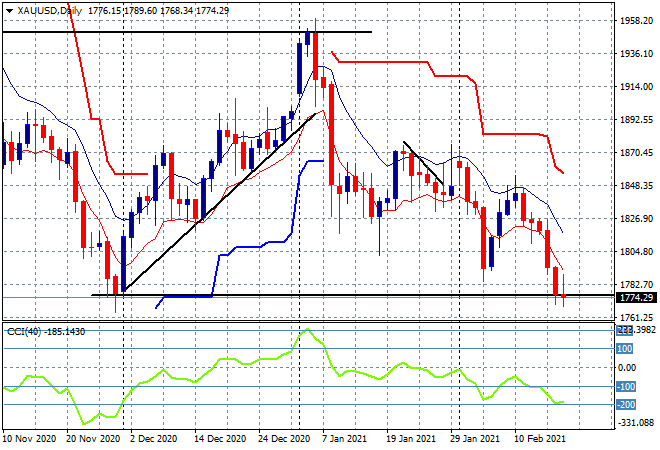
Gold continues to fail even with a weaker USD as it remains well below the key $1800USD per ounce level again as hovers right on the November low at $1775USD per ounce. Momentum is considerably oversold so there is the potential for a swing back higher, but there’s no medium term buyers here:
Glossary of Acronyms and Technical Analysis Terms:
ATR: Average True Range – measures the degree of price volatility averaged over a time period
ATR Support/Resistance: a ratcheting mechanism that follows price below/above a trend, that if breached shows above average volatility
CCI: Commodity Channel Index: a momentum reading that calculates current price away from the statistical mean or “typical” price to indicate overbought (far above the mean) or oversold (far below the mean)
Low/High Moving Average: rolling mean of prices in this case, the low and high for the day/hour which creates a band around the actual price movement
FOMC: Federal Open Market Committee, monthly meeting of Federal Reserve regarding monetary policy (setting interest rates)
DOE: US Department of Energy
Uncle Point: or stop loss point, a level at which you’ve clearly been wrong on your position, so cry uncle and get out!