
Friday’s mortgage commitments data from the Australian Bureau of Statistics (ABS) hit a fresh record high, driven by owner-occupiers:
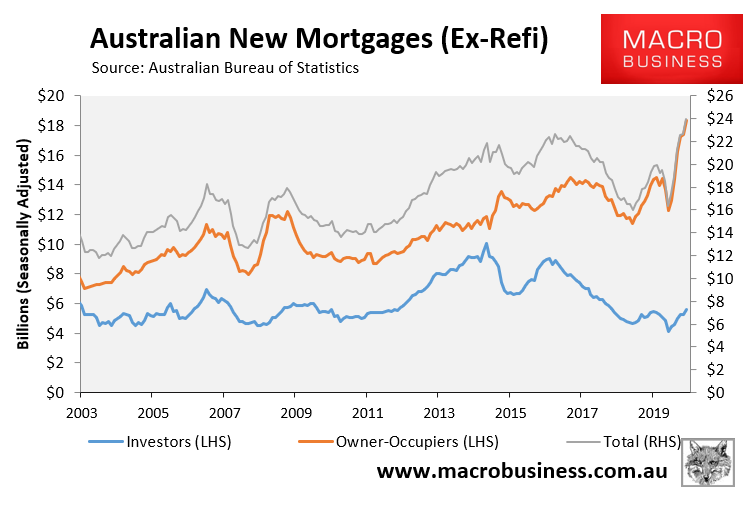
Total new mortgage commitments rose by 23.7% in the year to November, driven by a 31.4% surge in owner-occupied commitments whereas investor mortgage commitments rose by only 3.9% year-on-year.
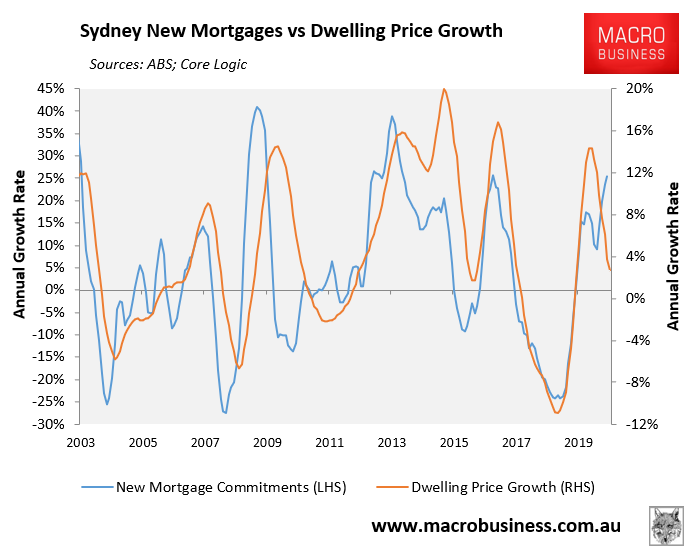
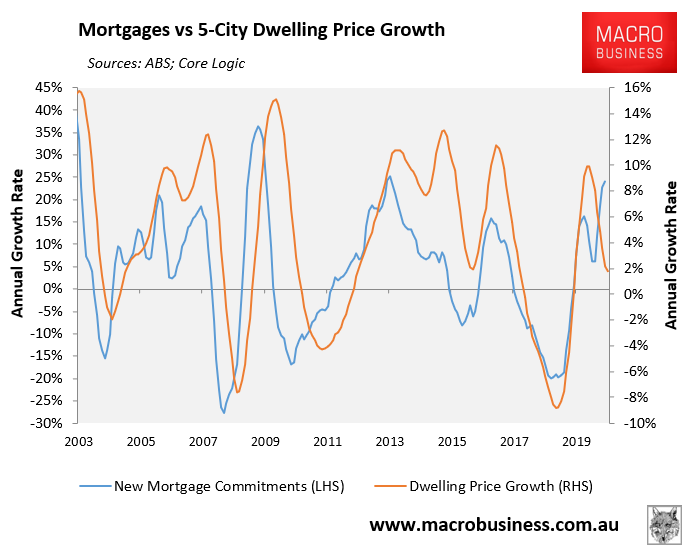
As readers know, we consider mortgage growth to be one of the best leading indicators of property price growth. This view is based on the strong historical correlation between mortgages and dwelling values.
Below are charts plotting the annual value of mortgage growth (excluding refinancings) against annual dwelling value growth.
First up is Sydney:
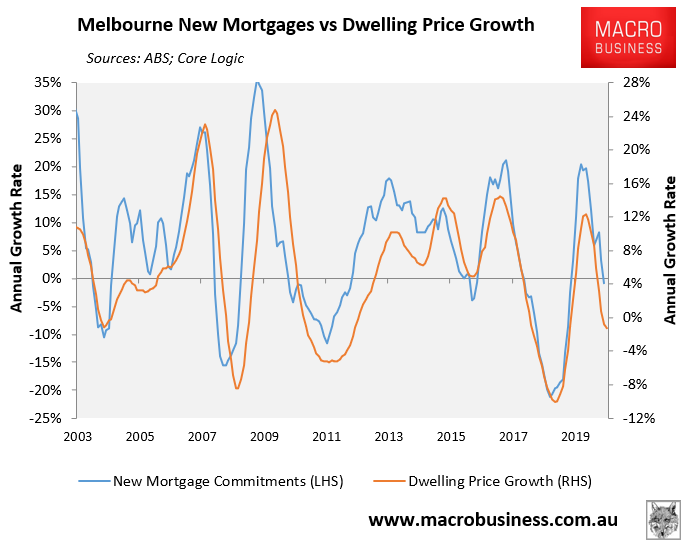
Next Melbourne:
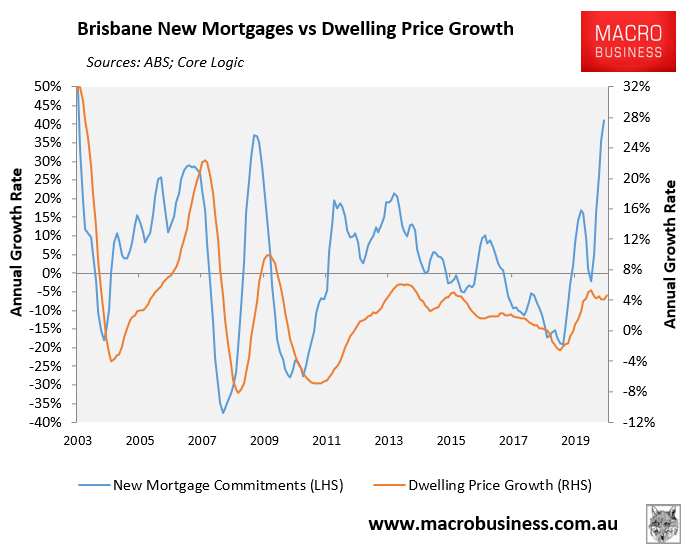
Brisbane:
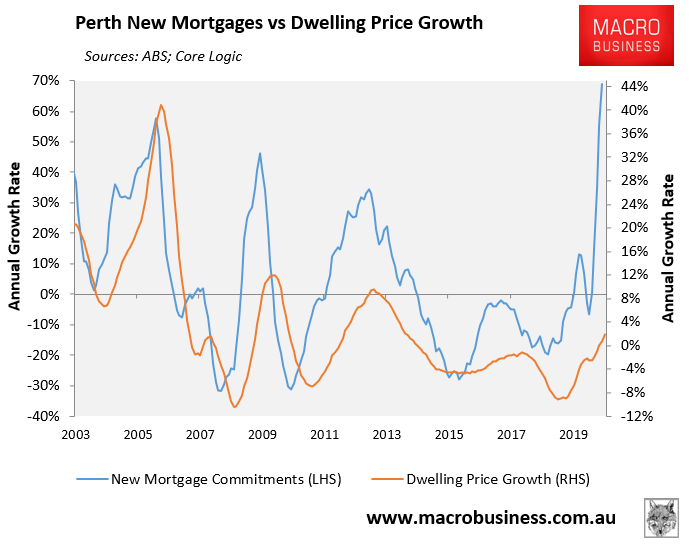
Perth:
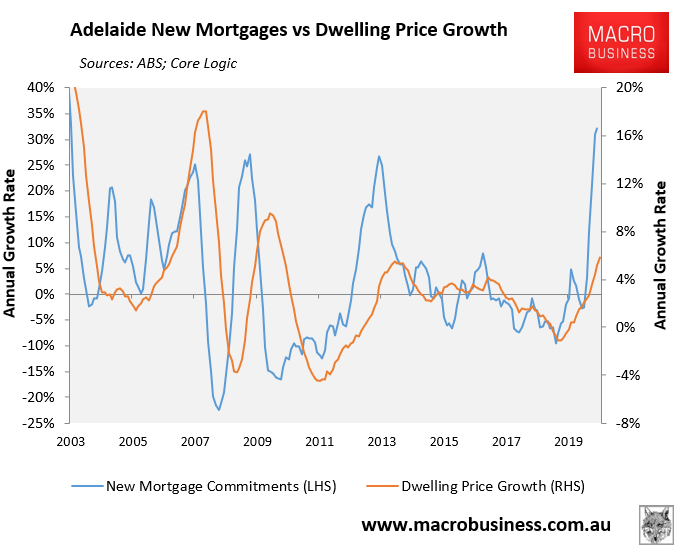
Adelaide:
Finally, here’s the picture nationally:
As you can see, the surge in mortgage growth has been driven by the smaller main capitals, namely Brisbane, Perth and Adelaide. This is also reflected in their stronger price growth:
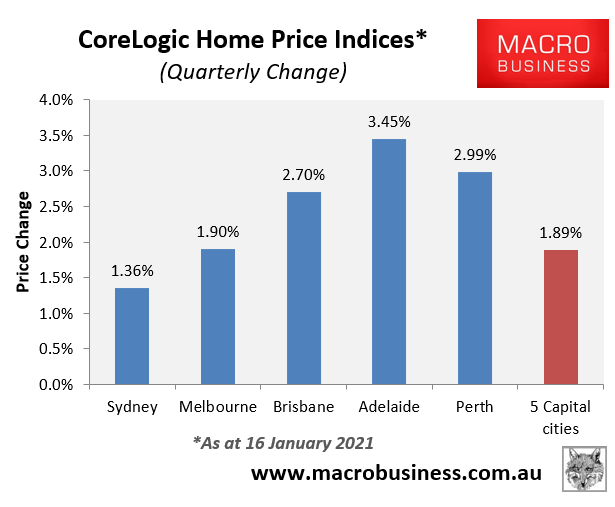
Judging my the above mortgage data, Perth and Brisbane property are looking particularly bullish.
