
It was the return of the king last night – king dollar that is – with yet another reversal in USD due to a very solid US inflation report, with core inflation bang on target while year on year inflation actually ticked higher than expected. This saw a selloff in the majors while the usual inflation hedges like stocks took a breather as this potentially broadcasted a tightening by the Fed (unlikely though that is), with even gold and silver selling off.
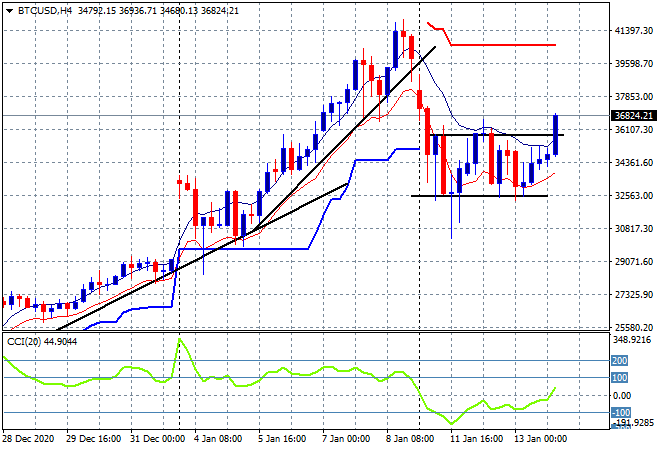
Oil and other commodities pulled back, but Bitcoin was definitely reactive, able to get out of its recent funk by bursting through the key $36000 level this morning. The four hourly chart showed clear resistance at this level after being supported at the $33000 zone following the two day long bear market, so we’re likely to see another run at the former highs as the HODL’rs ramp up once more:
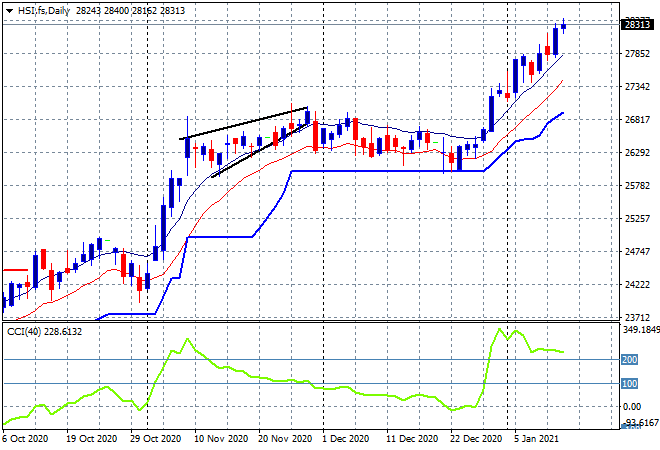
Looking at share markets in Asia from yesterday where the Shanghai Composite pulled back sharply after this lunch break but was able to cover most of this loss to finish down 0.3% to 3598 points, while in Hong Kong the Hang Seng Index did about the same, dropping a few points to remain above the 28000 point level. The daily chart is continuing to show a lovely breakout here as momentum remains heavily overbought with a solid trend channel looks with prices well above the high moving average so far:
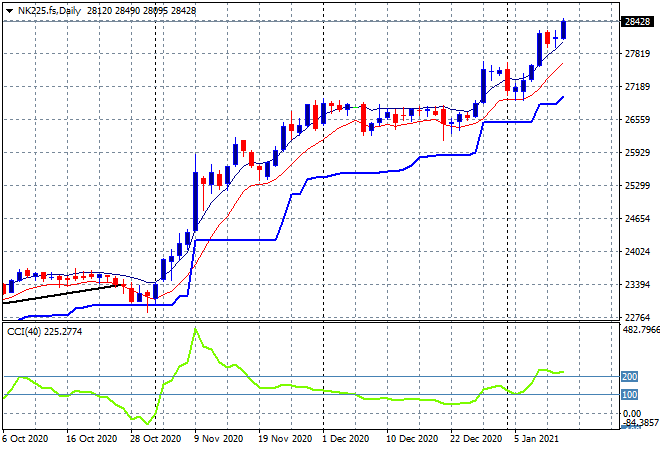
Japanese markets were the standout with the Nikkei 225 up by more than 1%, closing at 28446 points with futures suggesting even more upside this morning. Currency volatility may not be playing that big a role here with the machinations around the BOJ slashing GDP forecasts and general Asian share market exuberance (other peripheral markets are experiencing similar breakouts) helping too as the Nikkei is making new decade highs:
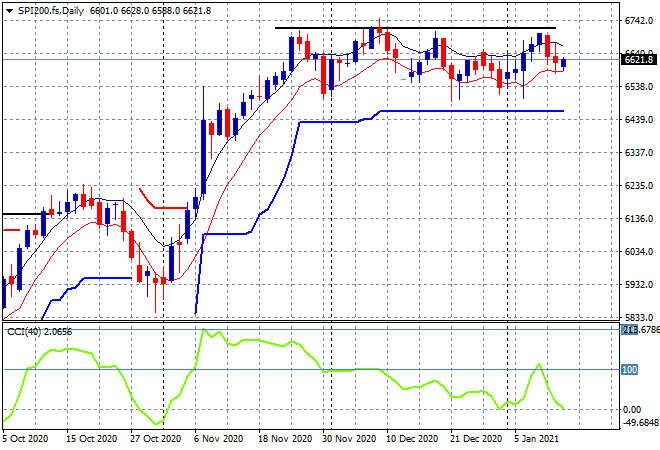
The ASX200 however was yet again unable to gain traction, lifting only 0.1% to 6686 points. SPI futures are in steady mode and while the daily chart has a clear rectangle pattern the lack of any upside is weighing as momentum inverts back below the overbought levels usually required for a breakout:
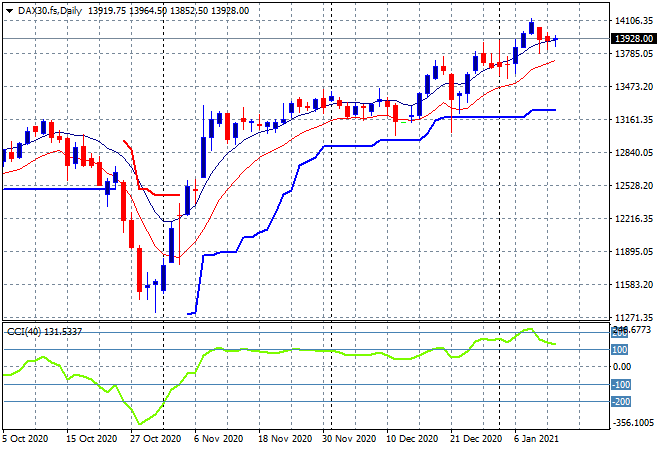
European markets were generally positive, although the non-European FTSE slipped a little despite lower Pound Sterling, with the German DAX representative of the continent, putting in a mild lift of 0.1% to finish at 13919 points. This consolidation remains steady here following the previous push above the previous highs as it reached the 14000 point level and while I remain cautious (with a loose stop at the low moving average), momentum is still looking good in the medium term:
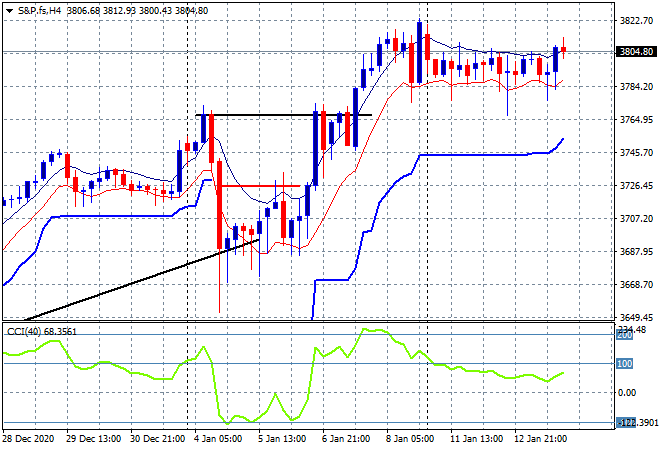
Wall Street had a similar modest session in reaction to the inflation print with the headline Dow down a few points while NASDAQ was again the best, finishing 0.4% higher while the S&P500 lifted 0.2% to remain just above the 3800 point barrier. The four hourly chart is still showing a small hesitation above the previous high but that resistance at the 3800 point level is still looking too strong in my view:
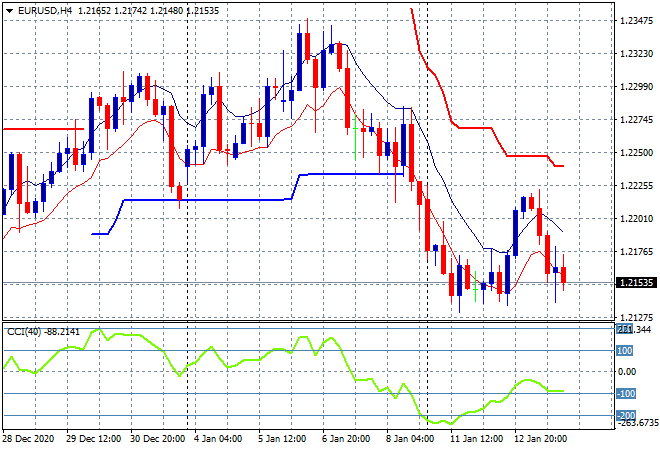
Currency markets swung back into USD strength in response to the inflation print with the Euro pushed straight back to its former intraweek low at the mid 1.21’s and putting it back on track for another breakdown. Notably, four hourly momentum is not yet oversold so this could be temporary:
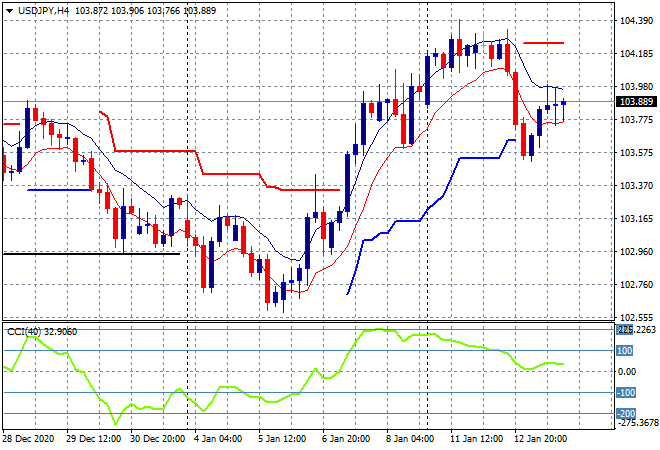
The USDJPY pair was able to come back a little more meekly than expected on the USD print, proving Yen buying still weighing here. I’m still wary of recent price action that shows 104 is a key resistance area, with the last few sessions showing an inability to get back above:
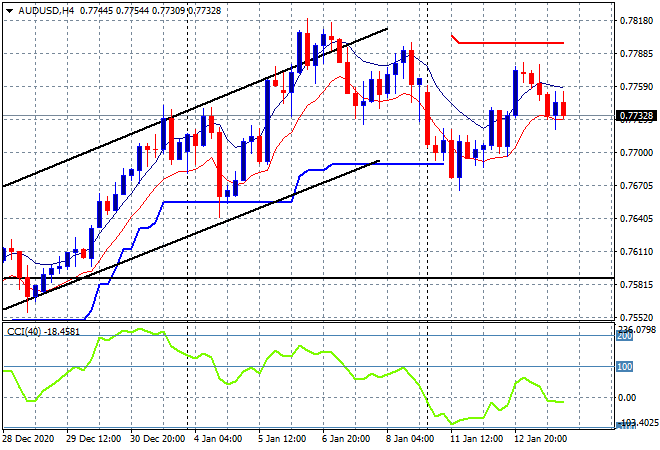
The Australian dollar was also unable to get out of its recent funk with the previous move higher thwarted again with a small selloff down to the 77.30 level where it sits this morning. While commodity prices remain very well supported, the overall risk proxy remains a weak factor. The target remains on the upside at the former high at the 78.20 level but I consider the 76.70 support level as the uncle point that must hold going forward:
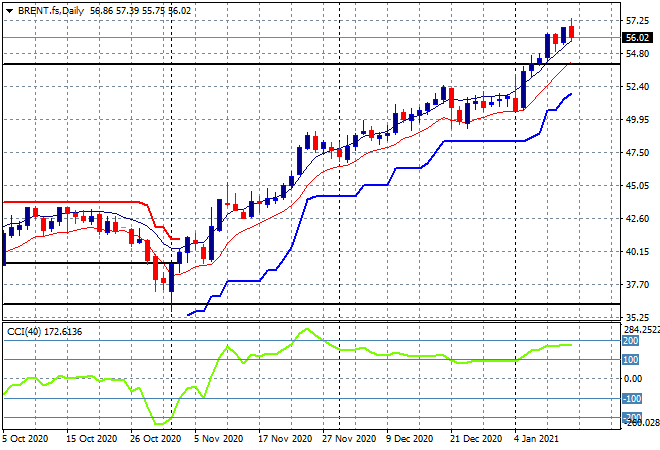
Oil prices pulled back slightly on the USD strength coming back with Brent crude remaining just above the $56USD per barrel level overnight. This keeps it well above the pre COVID February 2020 level (upper horizontal black line) with medium term support continuing to firm here:
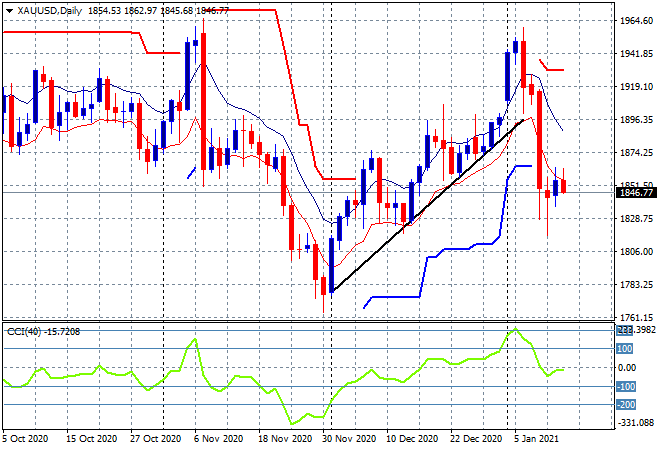
Gold remains the biggest loser as its continues to vacillate around the $1850USD per ounce level. I still contend this is not looking good for the shiny metal, even if those long tails on recent daily candles do show some short term support at least, its nowhere near out of the woods yet:
Glossary of Acronyms and Technical Analysis Terms:
ATR: Average True Range – measures the degree of price volatility averaged over a time period
ATR Support/Resistance: a ratcheting mechanism that follows price below/above a trend, that if breached shows above average volatility
CCI: Commodity Channel Index: a momentum reading that calculates current price away from the statistical mean or “typical” price to indicate overbought (far above the mean) or oversold (far below the mean)
Low/High Moving Average: rolling mean of prices in this case, the low and high for the day/hour which creates a band around the actual price movement
FOMC: Federal Open Market Committee, monthly meeting of Federal Reserve regarding monetary policy (setting interest rates)
DOE: US Department of Energy
Uncle Point: or stop loss point, a level at which you’ve clearly been wrong on your position, so cry uncle and get out!