

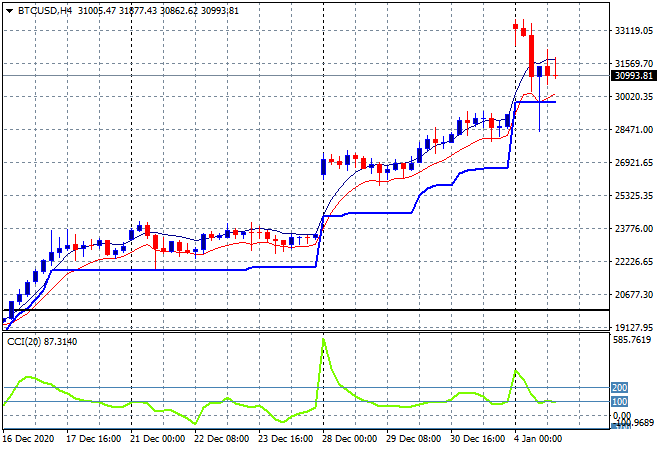
It was all set to be a clear path into 2021 with Asian and European stock markets doing well, as Wall Street lost confidence overnight in the wake of the UK virus lockdown and uncertainty around the US election (both presidential and upcoming Georgian senate races). This should prove a big headwind for stocks today here in Asia with futures indicating mild selloffs across the board. Commodities were mixed with iron ore rising while oil price moderated due to the latest OPEC+ meeting while gold built even further above its recent crack above the $1900USD per ounce level. Bitcoin couldn’t hold on to its massive 10% gap higher on the weekend open yesterday, retracing back below the $30000 mark before returning ot just below the $31000 level, with the four hourly chart indicating further volatility ahead:
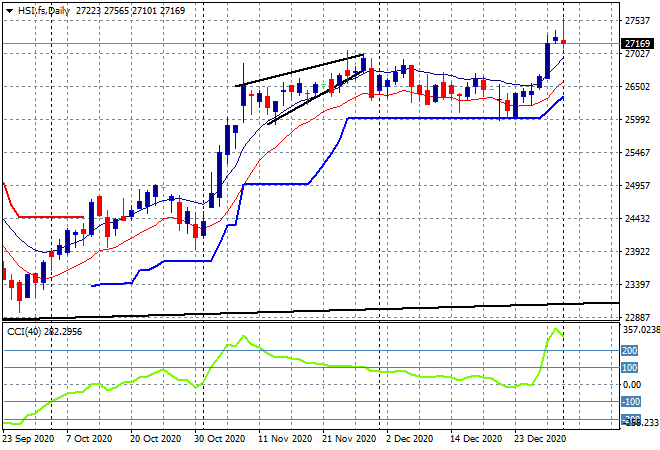
Looking at share markets in Asia from yesterday where the Shanghai Composite was up nearly 1% to just above the 3500 point level, while in Hong Kong the Hang Seng Index has followed in a similar vain, up 0.9% to 27472 points. The daily chart is still showing a nicely breakout that could have legs, although as I mentioned yesterday, momentum is clearly overbought and ripe for a pullback, but support at the 26000 point level is extremely firm:
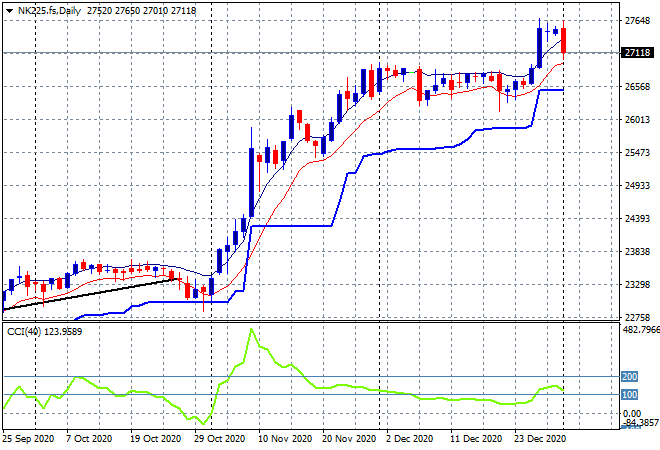
Japanese stock markets were the odd one out, with the Nikkei 225 losing 0.7% to close at 27266 points as trading in Yen firmed significantly. Futures are suggesting a pullback almost to the pre-breakout level around 27000 points and while daily momentum is in a nice position here to advance the market further, as always, watch the trajectory of a stronger Yen with some caution:
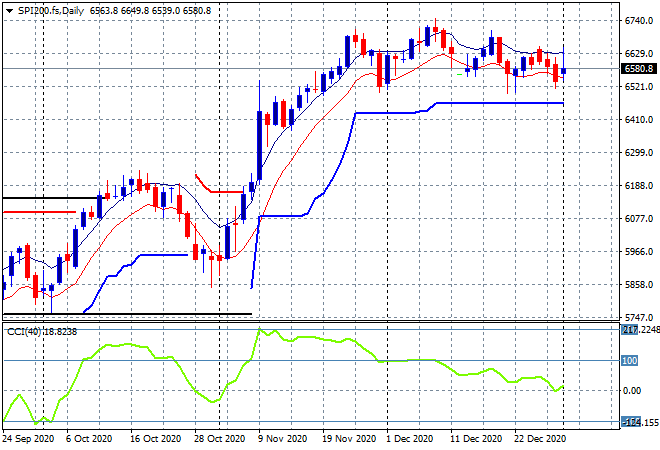
The ASX200 finished nearly 1.5% higher at 6684 points while the Australian dollar found some life as traders went all in. They may need to check their expectations with SPI futures indicating at least a 30 point drop on the open due to the falls on Wall Street overnight. The daily chart remains in a sideways bent without much upside potential yet, so we need some better momentum readings before getting too excited:
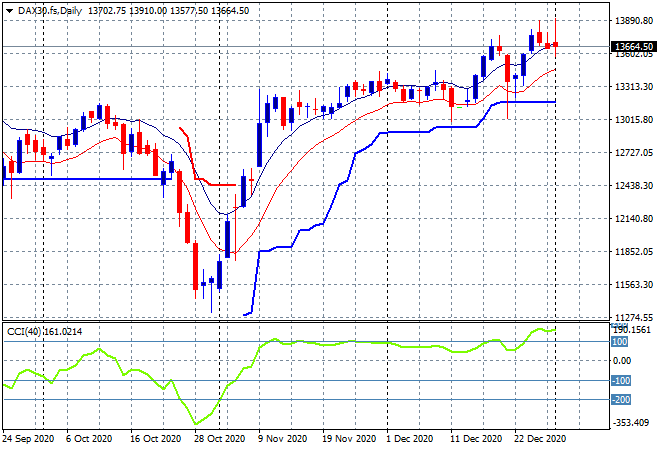
European markets were relatively good, with the FTSE putting in a sizable bounce (before the lockdown news) while the German DAX putting in a scratch session to finish a handful of points higher to 13726. The end of year breakout still requires another solid push on the opening of the trading year here to get back above the previous highs above 14000 points, but the daily candle price action is not yet convincing:
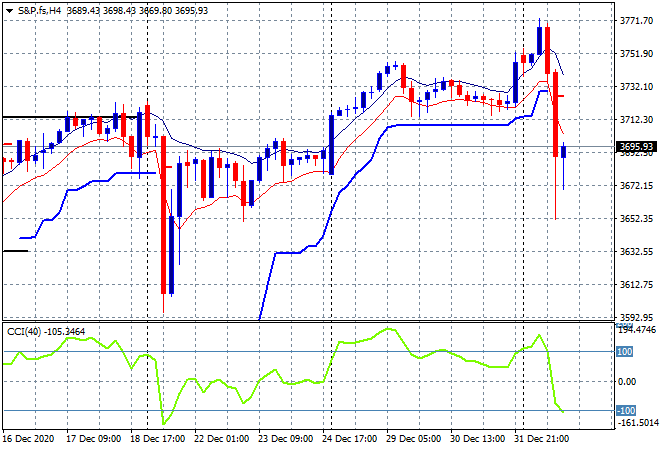
Wall Street opened with new record highs before retracing significantly as the Georgia special elections loomed large amid yet another Trump political crisis. The S&P500 closed nearly 1.5% lower to 3700 points exactly. The four hourly chart is again volatile with significant support levels taken out very easily once more – almost as easy at clearing new record highs on the upside. Maybe the road is open for further downside – we haven’t had second impeachment yet – but I remain skeptical:
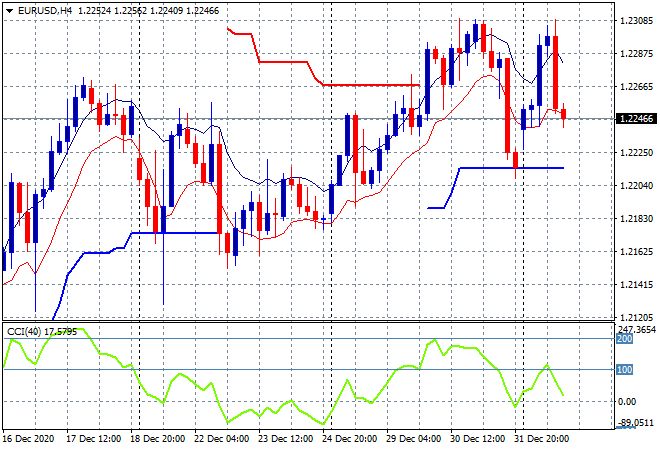
Currency markets are seeing increased volatility, now taking on US machinations alongside the Brexit and COVID dual contagions with Euro bouncing off the 1.22 handle up to the post Xmas level before round tripping again to below the mid 1.22 level. As I said yesterday, the recent inflection may not yet be supported in full so watch for a potential following through ATR support on the four hourly chart and the mid December lows at the 1.2160 as the guide to further downside going forward:
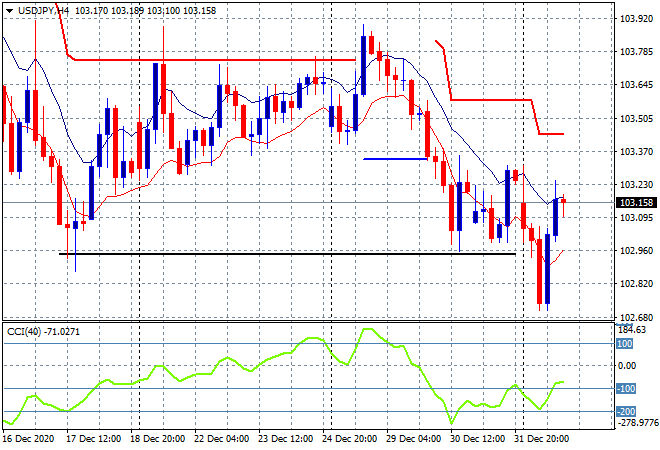
The USDJPY pair followed a similar trajectory, taking out key support at the December lows, before surging nearly a full 100 pips to get back above the 103 handle again. The swing play worked here but only after a big breakdown and fill in, adding to the volatility overall.I still contend we’re in a downward trajectory here with four hourly momentum still unable to gain positive readings:
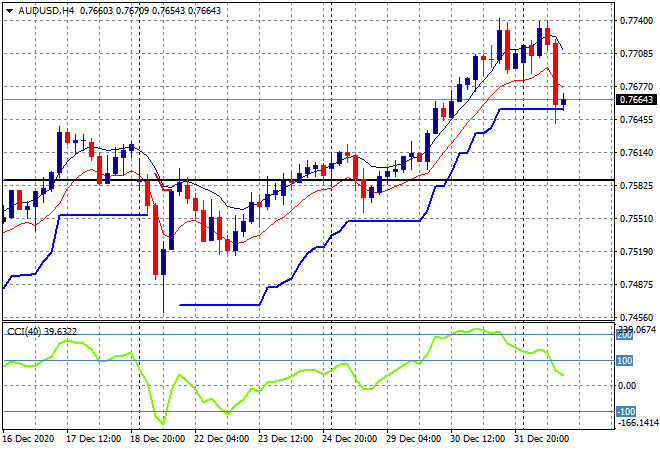
The Australian dollar had a more measured move with a straight test of the recent high that failed nicely and fell back to four hourly support at the 76.60 level as commodity prices came off the boil. As I said previously, the four hourly chart was looking overstretched as momentum rolls over, so continue to watch support at the 76.50 level closely for signs of a decent selloff:
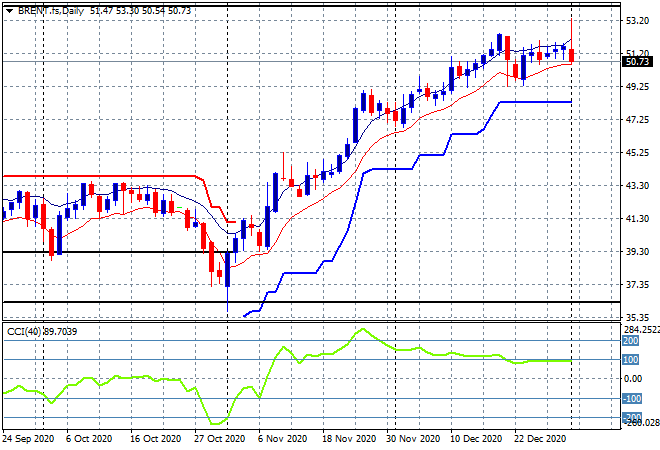
Oil prices caught the volatility bug as well in the wake of the OPEC+ meeting, eventually the Brent crude contract finished down, falling below the $51USD per barrel level, but only just hitting the recent lows. Short and medium term support is still holding at the $50 and $48.50 levels respectively, but this market requires a proper breakout above the $52.50 area:
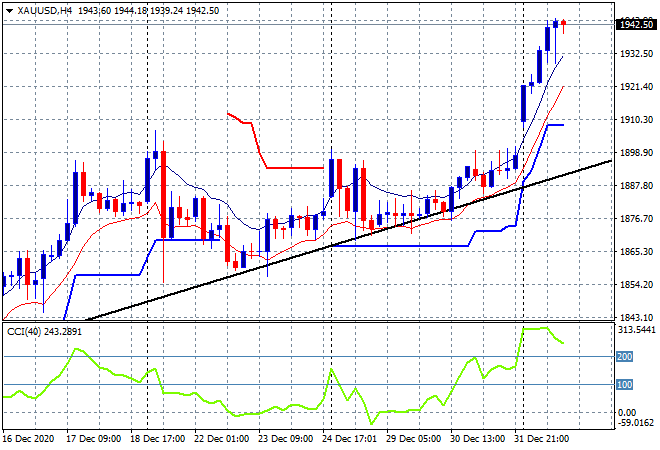
Gold is moving higher faster, but not stronger or better as it gets way ahead of itself and the Bitcoin cult, launching up to the $1940USD per ounce level in a move that will likely retrace by mid week. The nominal November high at the $1970 level is the next target, but momentum readings are way off and this will require some cooling down first:
Glossary of Acronyms and Technical Analysis Terms:
ATR: Average True Range – measures the degree of price volatility averaged over a time period
ATR Support/Resistance: a ratcheting mechanism that follows price below/above a trend, that if breached shows above average volatility
CCI: Commodity Channel Index: a momentum reading that calculates current price away from the statistical mean or “typical” price to indicate overbought (far above the mean) or oversold (far below the mean)
Low/High Moving Average: rolling mean of prices in this case, the low and high for the day/hour which creates a band around the actual price movement
FOMC: Federal Open Market Committee, monthly meeting of Federal Reserve regarding monetary policy (setting interest rates)
DOE: US Department of Energy
Uncle Point: or stop loss point, a level at which you’ve clearly been wrong on your position, so cry uncle and get out!