

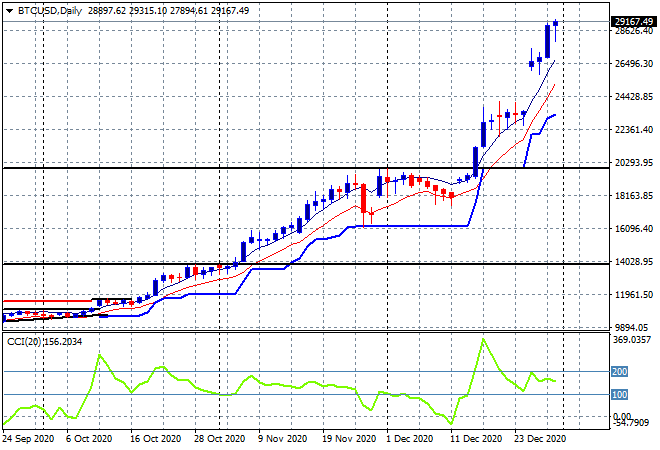
And we’re back for 2021 with risk markets really loving the Christmas/New Year break as US stocks go to new record highs, pushing up other risk assets along the way. The fly in the ointment of course was Brexit, with European and non-European bourses (aka FTSE) not having a sterling (sic) a time over the breakup. Commodities remain solidly bid with Brent and WTI oil rising while gold is ready to crack $1900USD per ounce. The standout of course is Bitcoin – jumping several thousand dollars and now on a race to the magical $30000 mark, having doubled in only six weeks or so:
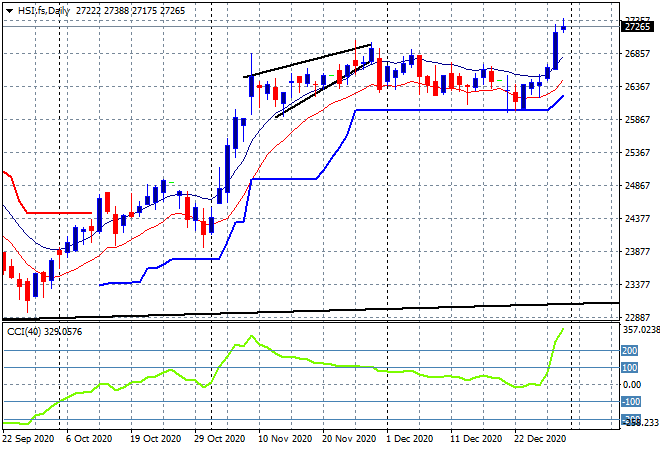
Looking at share markets in Asia from the last trading session of the year where the Shanghai Composite finished 1.7% higher to 3472 points, while in Hong Kong the Hang Seng Index it was a more modest 0.3% rise to 27231 points. The daily chart however shows a lovely breakout that could have legs as we start the calendar year, although momentum is clearly overbought, but support at the 26000 point level is extremely firm, so any pullback will likely result in dip buying:
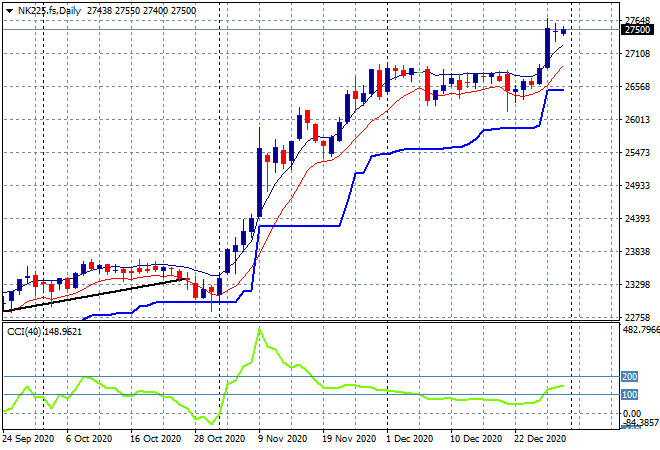
The Nikkei 225 also had a great breakout, finishing 0.5% higher to 26926 points with futures suggesting even better buying support on the open this week as the long held sideways market finally goes somewhere. Daily momentum is in a nice position here to advance the market further, but continue to watch Yen which remains firm:
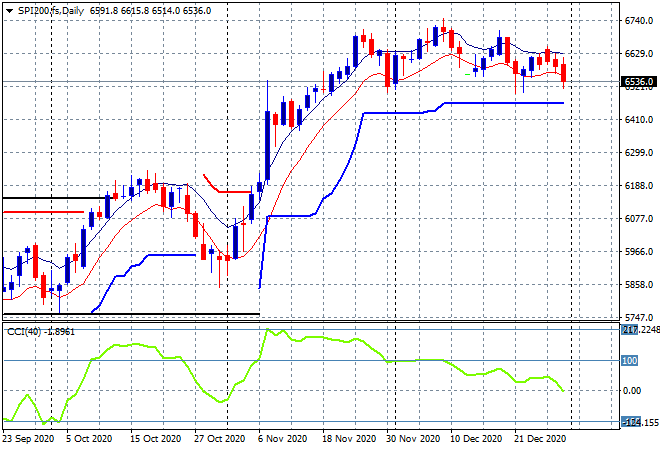
The ASX200 finsihed at 6587 points but SPI futures are indicating a big lift on the open this morning to crack back above the 6600 point level, despite all the Xmas/NY concerns over a new COVID breakout. The key level to beat here remains the previous 6700 point resistance area with a launch off of strong daily support at or just below the 6500 level needing some better momentum readings before getting too excited:
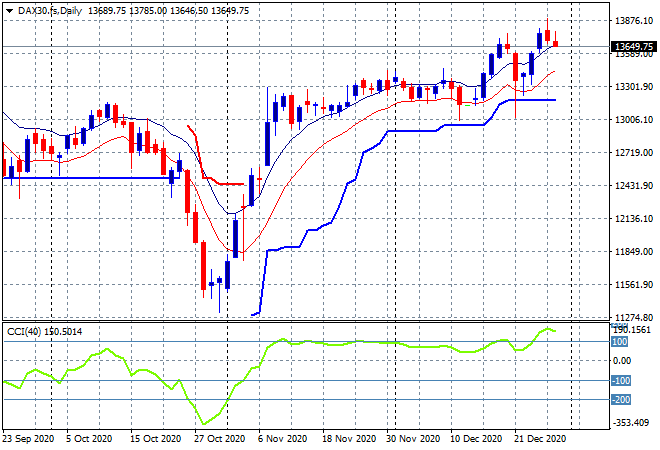
European markets had a small bounce but have pulled back on the Brexit deal and US tariffs, with the German DAX closing 0.3% lower at 13718 points. The end of year breakout requires another solid push on the opening of the trading year here to get back above the previous highs above 14000 points, but the daily candle price action is not yet convincing:
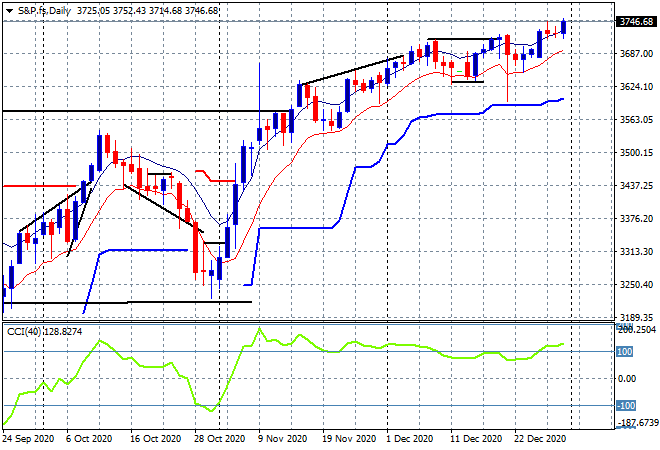
Wall Street however is loving a new Biden administration, only weeks away with the NASDAQ and the S&P500 closing to new record highs, the latter up 0.6% to 3751 points. The daily chart is pretty clear on the trajectory of this market so far, with momentum only slightly overbought as support remains firm above the 3620 point lows. After clearning the 3700 handle, the sky is the limit here – despite all the volatility around the Ted Lizard Cruz coup, massive pandemic and Trump’s warmongering over Iran:
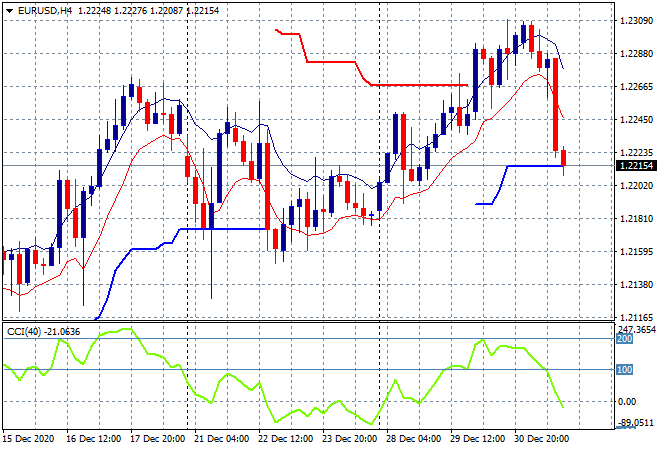
Currency markets are seeing increased volatility around the Brexit and COVID dual contagions with Euro flopping down to the 1.22 handle as traders (and their bots) return to the markets. This inflection may not yet be supported in full so watch for a potential following through ATR support on the four hourly chart and the mid December lows at the 1.2160 as the guide to further downside going forward:
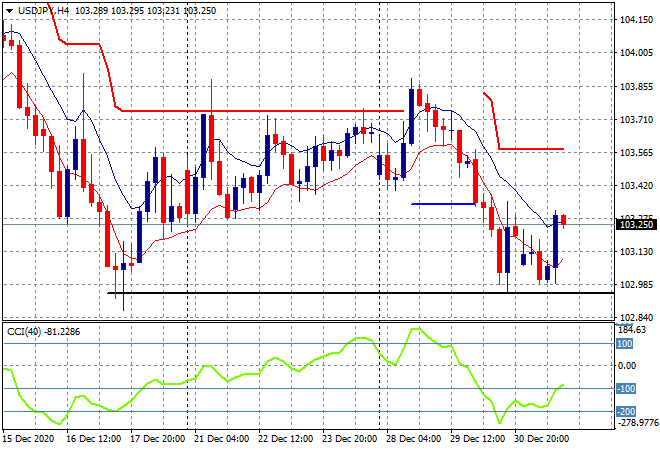
The USDJPY pair has been able to firm at the December lows, finding more support relatively speaking as it pipped just above the 103 handle. A classic swing higher play is firming here, watch for another close above the high moving average to confirm, but it probably will only have legs up to the previous weekly support zone at the 103.60 area:
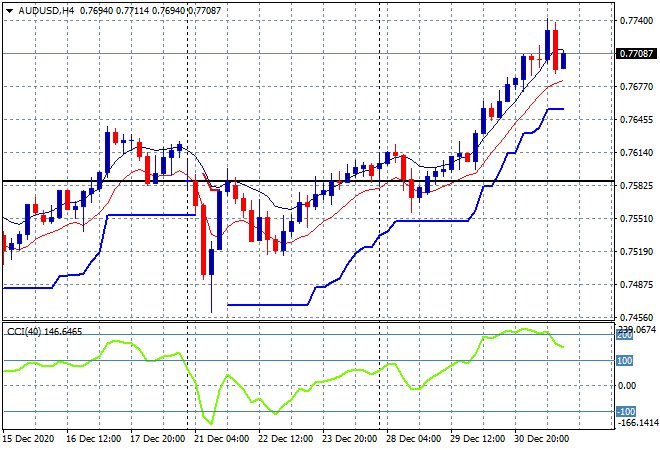
The Australian dollar continues to enjoy the risk bid alongside commodities and finished the year just above the 77 handle and looks set to make another launch from that position as we get back onto the trading screens in earnest this week. The four hourly chart is looking overstretched as momentum rolls over, but low volatility could be to blame here. Watch support at the 76.50 level closely:
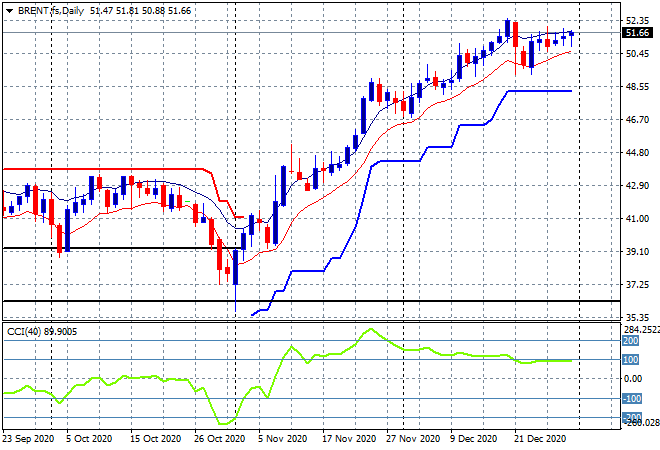
Oil prices remain relatively firm, with Brent crude finishing just below the $52USD per barrel level with a series of modest up sessions to finish out the year in low volume. Short and medium term support is holding at the $50 and $48.50 levels respectivelly, so watch for a potential new high to breakout above the $52.50 area:
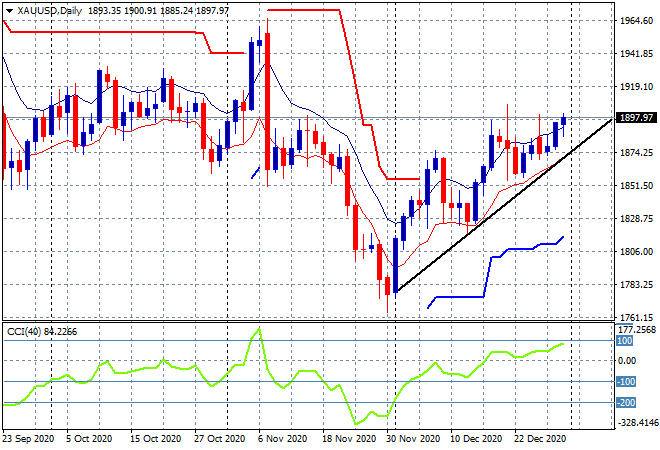
Gold had a much better December, almost finishing out the year above the $1900USD per ounce level as its swing from a very oversold breakdown saw it gain well over $100USD per ounce. The daily chart shows a nice trend in full development but it will require some more momentum yet before able to get back above the nominal November high at the $1970 level:
Glossary of Acronyms and Technical Analysis Terms:
ATR: Average True Range – measures the degree of price volatility averaged over a time period
ATR Support/Resistance: a ratcheting mechanism that follows price below/above a trend, that if breached shows above average volatility
CCI: Commodity Channel Index: a momentum reading that calculates current price away from the statistical mean or “typical” price to indicate overbought (far above the mean) or oversold (far below the mean)
Low/High Moving Average: rolling mean of prices in this case, the low and high for the day/hour which creates a band around the actual price movement
FOMC: Federal Open Market Committee, monthly meeting of Federal Reserve regarding monetary policy (setting interest rates)
DOE: US Department of Energy
Uncle Point: or stop loss point, a level at which you’ve clearly been wrong on your position, so cry uncle and get out!