
Bloomberg are out today with a piece about how the short term risk of iron ore topping out and the ongoing trade squabble with China may upset the plans of economists forecasting the Australian dollar to hit the 80 cent level later this year.
To wit:
Traders have seized on every scrap of good news to push the Australian dollar higher in recent months, leaving it vulnerable to a pull-back as it approaches the key psychological level of 80 U.S. cents.
The currency surged almost 10% in 2020 as strategists ratcheted up forecasts for the Aussie on rising commodities prices, a sharper-than-expected economic rebound and local success containing Covid-19.
The Democrat victories in the U.S. Senate races this week, which have raised the odds of a Biden Administration unleashing more fiscal aid, may already be priced into the market, given with Aussie’s 1% year-to-date advance.
In the meantime, U.S. Treasuries offer opportunities not seen for months, with the 10-year yield rising above 1%. Some investors are also exiting short positions in the greenback after the Bloomberg Dollar Spot Index approached its February 2018 low.
If these hurdles prove too much for the currency and it reverses course, peaks on monthly charts near 74 U.S. cents stand as key support.
Does the weekly/monthly chart bear (sic) that out? I wouldn’t say key or terminal support exists at 74 cents, rather down at the 70 handle proper which was the August/September lows that was well supported, plus acted as key resistance throughout most of the last two years:
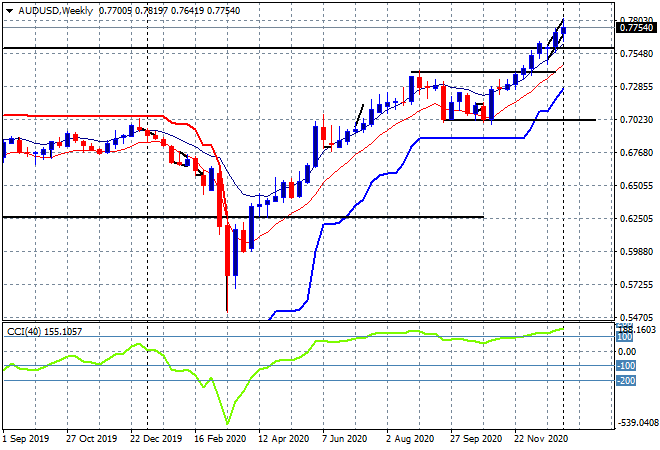
A key factor about the Australian dollar is its wide trading range, exemplified by the ATR or average true range, with a variance of about 200 pips or 2 cents at least each month. So in reality, support is between the last nominal high before the recent breakout at 74 cents and 70 cents – or about 2 months average true range. Nevertheless, if iron ore does continue on its merry way, the 80 cent level could be breached sooner rather than later.
Bitcoin has a much different structure, but like all tradeable “things” it does have technical analysis fundamentals. One of those is a series of wobbles (large trading ranges at a recent high) in the last 24 hours after recently breaching the $40,000 barrier. Note the ranging candles on the hourly chart since the overnight trade – having more than doubled in 22 days, the hourly chart is broadcasting a possible tipping point here as a point of control around the $38500 point level firms:
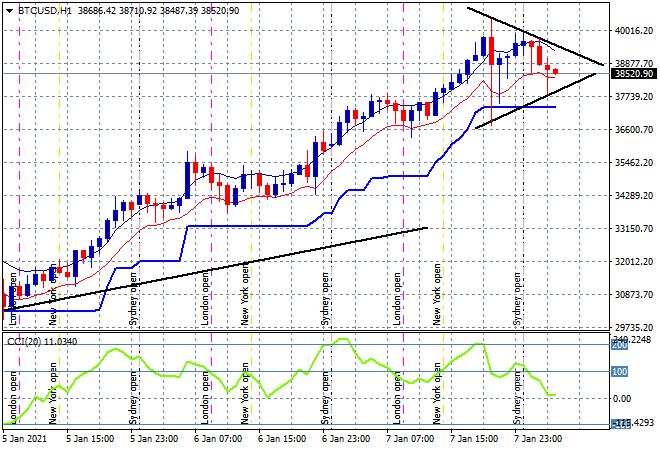
The digital tulip may still bloom a little further, but the volatility on the downside could be epic.