On Friday, the Australian Bureau of Statistics (ABS) released its 2019-20 Australian System of National Accounts (ASNA) data release, which provides a detailed presentation of annual national accounts data.
Locked away on Table 61 is my favourite section of the release: data on aggregate land values at the state and national levels. This year’s release confirmed that, at a national level, the land values underpinning the Australian housing bubble rebounded when measured against GDP, lead by Victoria (Melbourne) and New South Wales (Sydney).
The below chart summarises Australia’s aggregate land values by use relative to Australia’s gross domestic product (GDP) since 1989, which is as far back as the data goes:
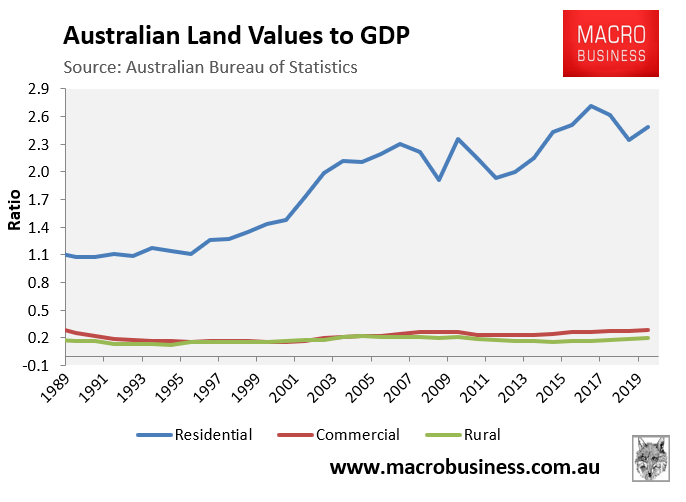
Whereas aggregate Australian Commercial and Rural land values have remained fairly stable over the past 26 years relative to GDP, residential land values skyrocketed, rising from 1.1 times GDP to a peak of just below 2.71 times GDP in 2016-17. However, Australian residential land values deflated to a trough of 2.34-times GDP in 2018-19 before rebounding to 2.49 in 2019-20.
When the aggregate residential land values data is combined with the Reserve Bank of Australia’s (RBA) dwelling values data – which combines both residential land values and structures (buildings) – it becomes clearly evident that the uplift in Australia’s housing values over the past 20 years was due almost entirely to increasing land costs, rather than higher building costs (see below chart).
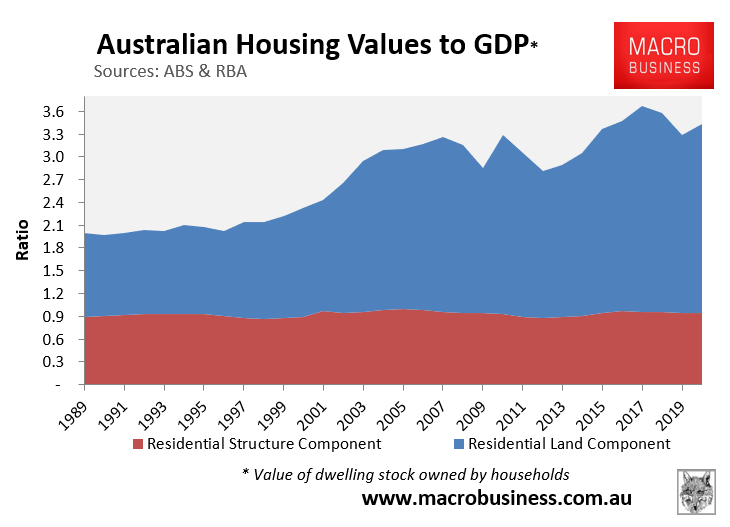
Whereas the structure values to GDP – calculated by deducting the ABS’ residential land value figures from the RBA’s dwelling assets data – was 0.89 times GDP in 1988-89, it was only 0.95 times GDP in 2019-20 and has remained fairly stable throughout the entire 29-year period.
Not surprisingly, given the correction in land values, the total value of Australia’s housing stock (land plus structures) also rose to 3.43-times GDP in 2019-20, but remained below the all-time high 3.67-times GDP in the 2016-17 financial year.
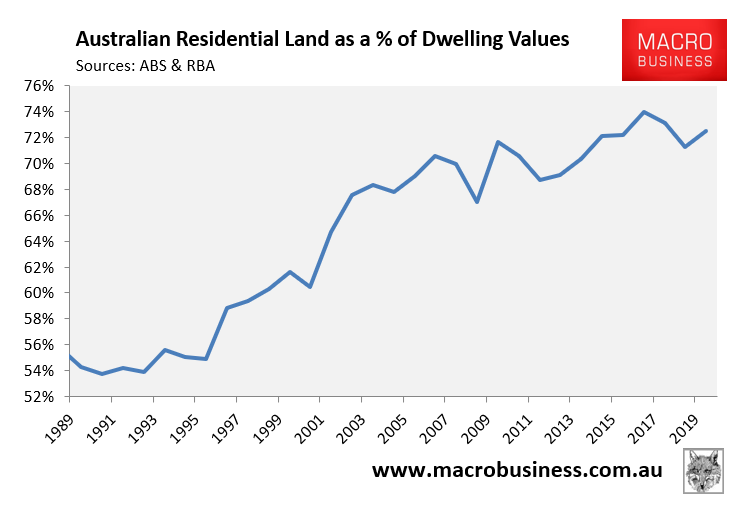
Reflecting the fact that residential land has risen in value relative to buildings, the land component of Australia’s housing stock rose from a low of 54% in 1990-91 to a peak of 74% of GDP in 2016-17, and stood at 72% of GDP in 2019-20:
The below chart tracks the change in nominal residential land values at the state and territory level over the 2018-19 financial year:
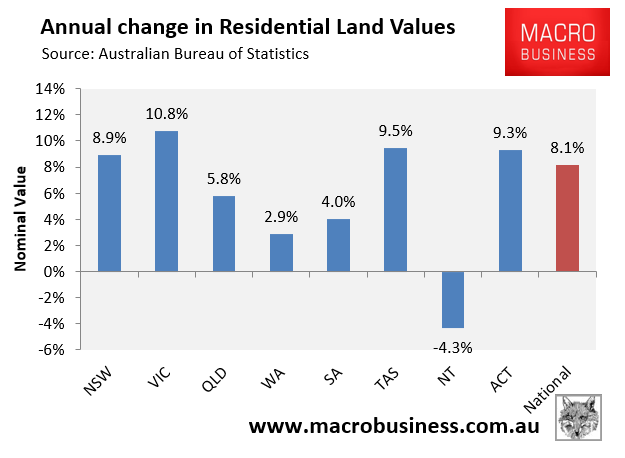
Victoria (read Melbourne) and NSW (read Sydney) drove the rise in land values nationally over 2019-20, driven by the huge surge in values in the nine months leading up to the beginning of the COVID-19 pandemic.
