

Risk sentiment tried to change course on Friday following a relatively solid Asian and European session as the stimulus problem in the US was exarcebated by a negligent Republican Senate and a divergence in views between Trump’s Treasury and the US Federal Reserve. The exponential spread of COVID-19 is still not registering on traders screens as a risk factor going into Thanksgiving (likely to be the worst superspreader event of the year), with October’s retail sales numbers surprising on the upside, and a better than expected oil demand survey also boosting Brent and WTI crude prices.
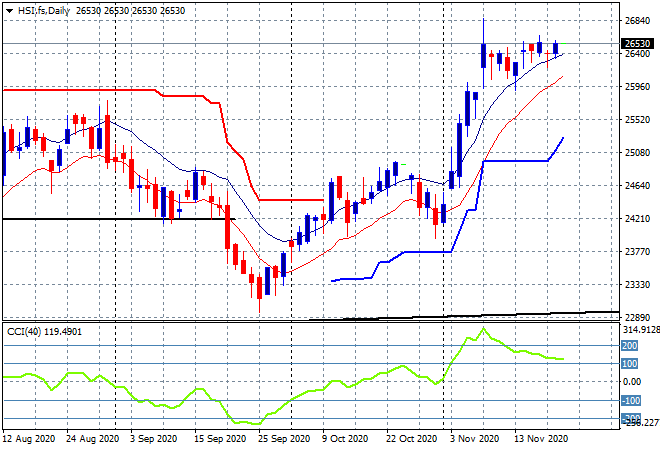
Looking at share markets in Asia from Friday’s session where the Shanghai Composite was slowly eking out a scratch session before a boost at the close saw it lift more than 0.4% to 3377 points while in Hong Kong the Hang Seng Index clawed back its recent losses, finishing up 0.6% to 26451 points. The daily chart is in stall mode here as momentum reverts from its overbought mode as daily price action continues to slide sideways, unable to punch through resistance at the 26800 point level:
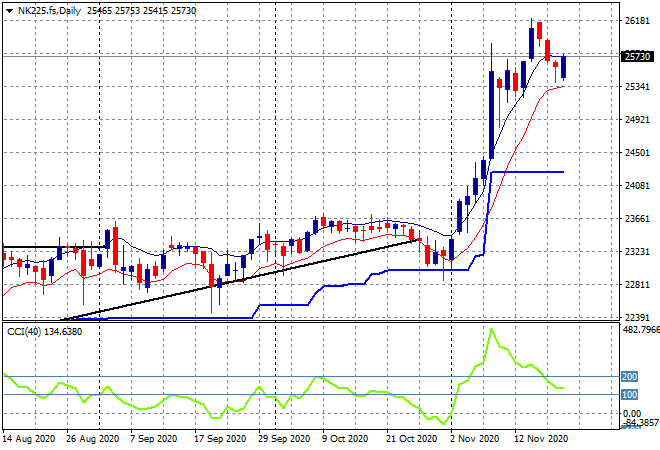
Japanese stock markets remained in retracement mode with the Nikkei 225 lower by 0.4% to 25527 points. Futures are suggesting a lift on the open this morning however, but I’m still watching the 25300 point zone for signs of a breakdown:
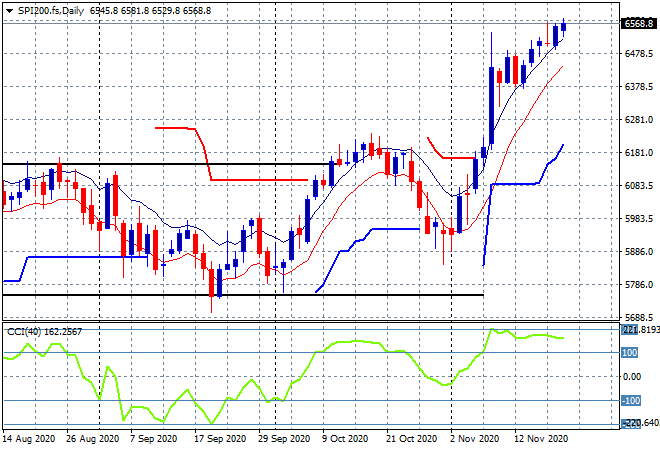
The ASX200 also put in a scratch session after a big week, closing just a few points lower at the 6539 level. The daily chart is slowly moving away from the flat trajectory of other equity markets and extending further instead, with momentum still overbought. SPI futures indicate another firm open this morning as the session highs above 6500 points suggest a breakout:
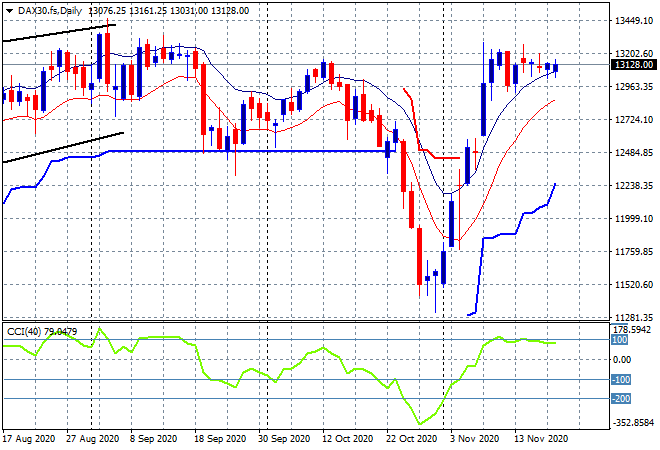
European markets had modest rises across the continent, with the German DAX lifting 0.4% to close at 13137 points. This market is stalled as well with no new session highs in a couple weeks, so I don’t expect much upside unless more positive COVID news comes down very quickly:
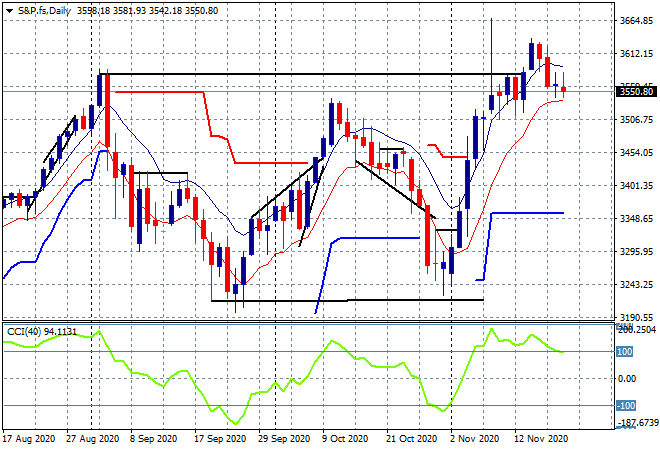
Wall Street soured on stimulus sentiment as the S&P500 finished 0.7% lower at 3557 points. The daily chart still shows a market unable to break higher as hesitation turns into broader caution here as momentum nosedives and support at the 3500 point level comes into focus:
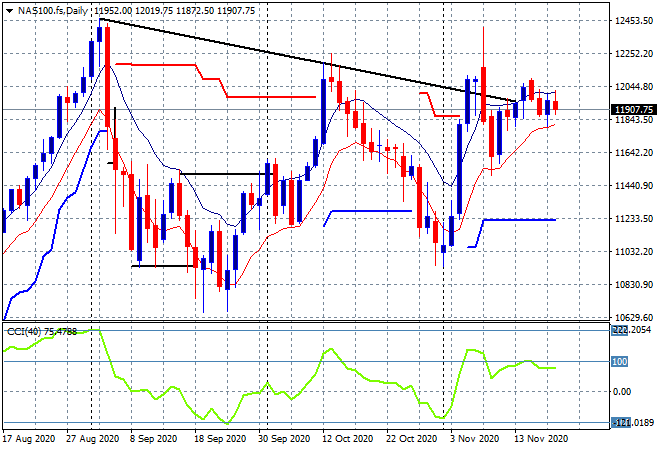
The NASDAQ took back most of its previous results to lose 0.4% and close the week at 11854 points. The pattern on the daily chart remains nominally bearish as price action is still unable to clear the downtrend from the August bubble like highs (upper black sloping line). The key is daily support to hold on at the 11500 point level and then push above 12000:
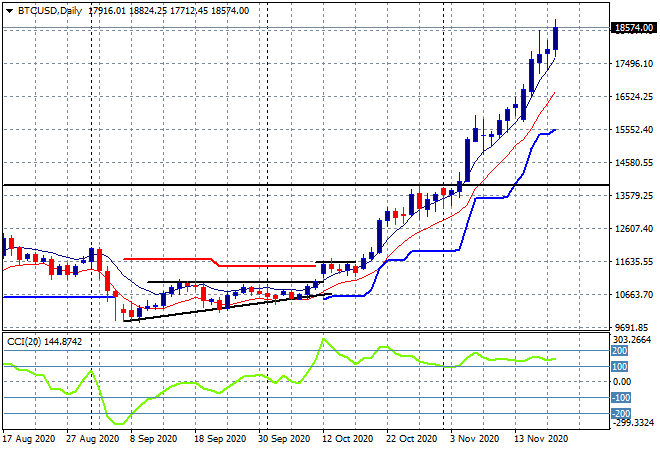
Bitcoin’s bubble like breakout still cannot be held back, this time with a definitive new daily high and closing out the week well above the $18000 level which tossed aside any notion of temporary resistance as the FOMO trade re-engages and its warp speed ahead to $20000:
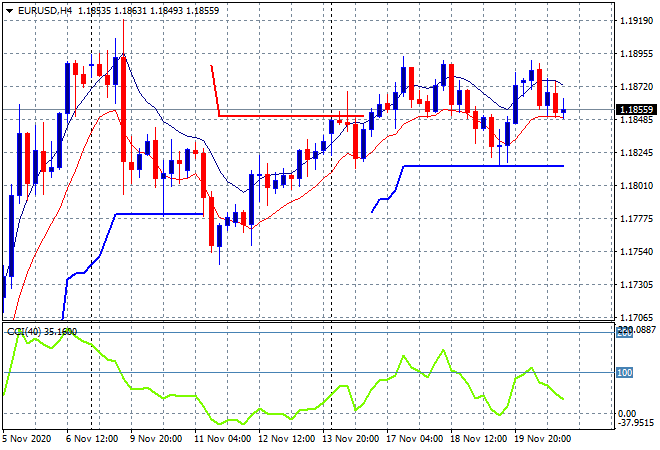
Currency markets saw USD firm against most in the wake of the retail sales print with Euro breaking back to the mid 1.18 level, basically where it started the week after unable to build on the intraweek high at the 1.1880 level. ATR support at the 1.18 handle proper has remained firm but could be under pressure again as the medium term pattern turns slightly bearish:
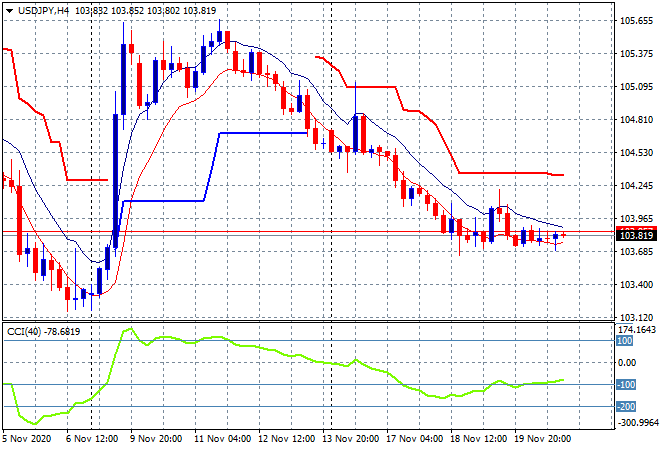
While the USDJPY pair remains in a medium term downtrend, its finding somewhat of a bottom here as USD firms, finishing just below the 104 handle but still looking very weak. This keep it above the previous intraweek low at the 103.70 level, so while the four hourly chart remains bearish there is some hope to be found here:
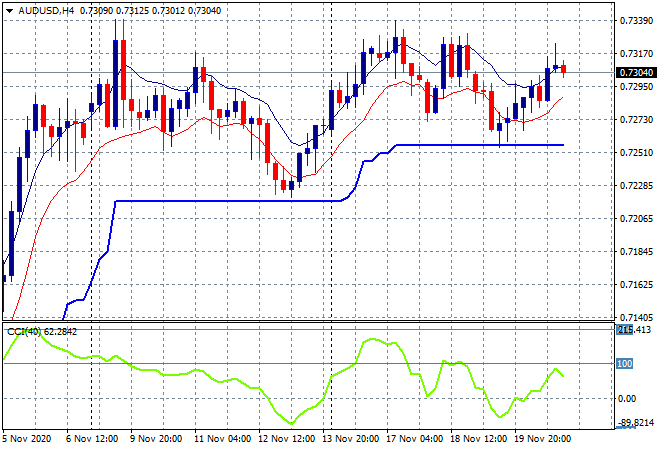
The Australian dollar is still holding on, having moved slightly higher on Friday night but unable to make a new weekly high, finishing just above the 73 handle proper. Four hourly ATR support at the 72.50 level must here or this two week long sideways move will capitulate:
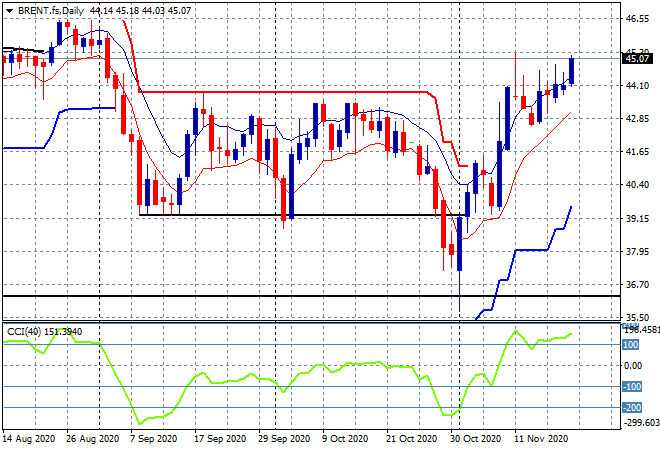
Oil prices are again rising, getting out of their funk and pushing through resistance at the September/October points of control, with Brent finishing above the $45USD per barrel level for the first time since August. The short setup I was expecting hasn’t eventuated but this looks toppy still:
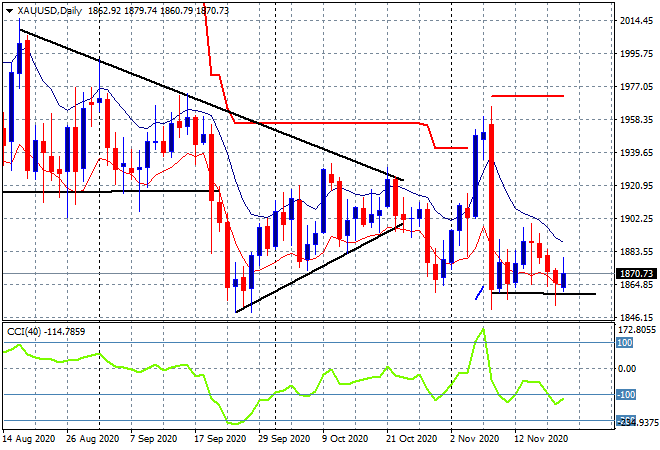
Gold had a minor reprieve on Friday night but the daily chart remains bearish with a close at the $1870USD per ounce level not really exciting on any front. Terminal support at the $1860 level is still the next target below:
Glossary of Acronyms and Technical Analysis Terms:
ATR: Average True Range – measures the degree of price volatility averaged over a time period
ATR Support/Resistance: a ratcheting mechanism that follows price below/above a trend, that if breached shows above average volatility
CCI: Commodity Channel Index: a momentum reading that calculates current price away from the statistical mean or “typical” price to indicate overbought (far above the mean) or oversold (far below the mean)
Low/High Moving Average: rolling mean of prices in this case, the low and high for the day/hour which creates a band around the actual price movement
FOMC: Federal Open Market Committee, monthly meeting of Federal Reserve regarding monetary policy (setting interest rates)
DOE: US Department of Energy
Uncle Point: or stop loss point, a level at which you’ve clearly been wrong on your position, so cry uncle and get out!