

Risk sentiment is still very cautious as optimism over vaccines outweighs concerns over rising COVID cases and economic restrictions. Wall Street rallied on the close on rumors of possible stimulus progress in Congress (which is the opposite of progress I think someone once said).
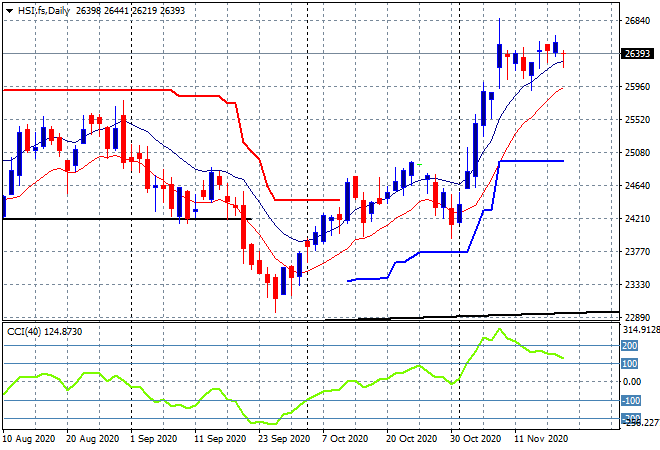
Looking at share markets in Asia from yesterday’s session where the Shanghai Composite was down at the start of the session but regained firmly in the last hour, closing 0.5% higher to 3363 points while in Hong Kong the Hang Seng Index has flopped the other way, losing 0.7% to finish at 26356 points. The daily chart is almost in a stall mode here as momentum reverts from itsoverbought mode as daily price action is now sliding sideways, unable to punch through resistance at the 26800 point level:
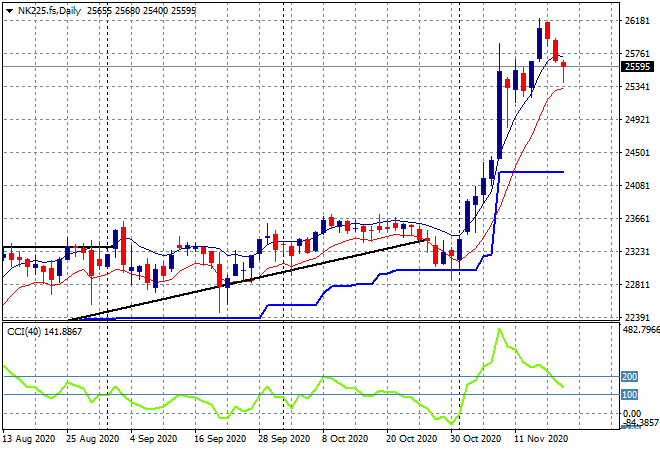
Japanese stock markets remained in retracement mode with the Nikkei 225 off 0.4% to 25634 points s. Futures are suggesting another pullback on the open this morning although it could be thwarted by the late rise on Wall Street move as this market is still way overextended and ripe for a proper retracement. I’m still watching the 25300 point zone for signs of a breakdown:
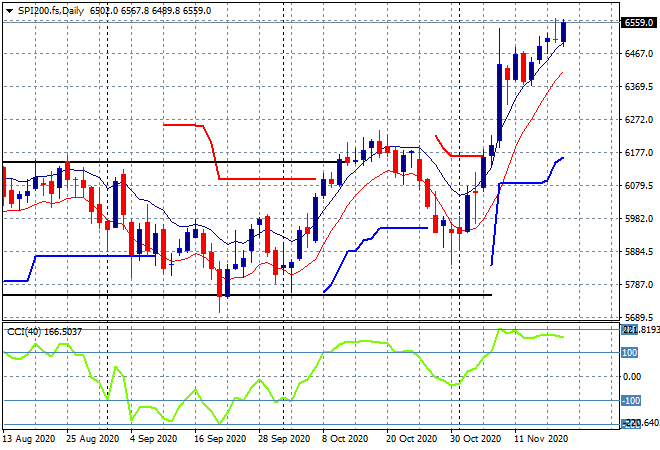
The ASX200 was able to absorb the latest unemployment print without much concern, raising 0.2% to 6547 points. The daily chart is slowly moving away from the flat trajectory of other equity markets and extending further instead, with momentum still overbought. SPI futures indicate another firm open this morning as the session highs above 6500 points suggest a breakout:
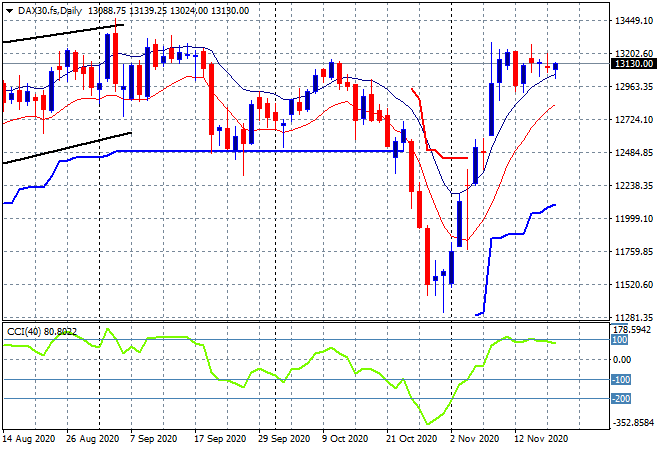
European markets had modest pullbacks across the continent, taking back most of the gains so far this week, with the German DAX losing 0.9% to close at 13086 points. It came back a little in post close futures as Wall Street rallied but the daily chart is still showing strong resistance at the August highs at just over the 13000 point level that so far can’t be beat:
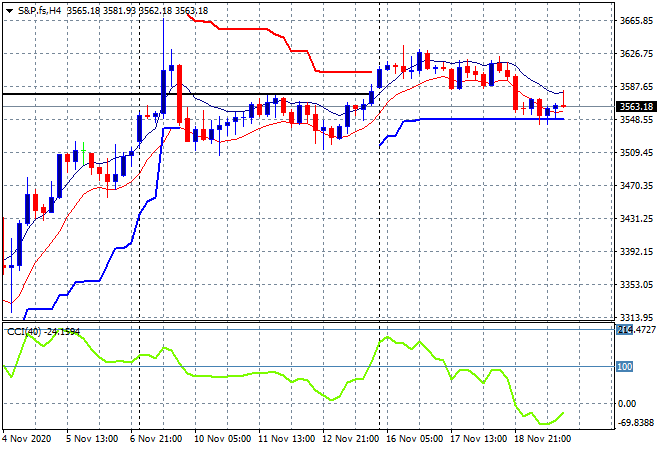
Wall Street was down most of the session and only found that punch later on as the S&P500 lifted near to the close to finish 0.4% higher at 3581 points. The four hourly chart however still shows a market unable to break higher as hesitation turns into broader caution here as momentum nosedives and support at the 3500 point level comes into focus:
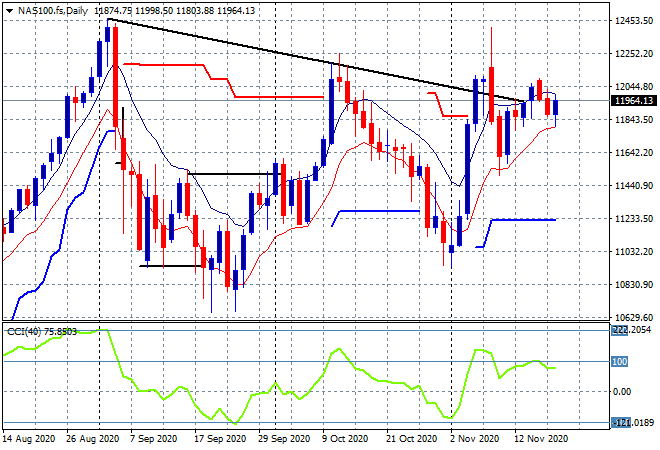
The NASDAQ had a better result, taking back its previous losses to gain 0.8% and close at 11904 points. The pattern on the daily chart remains nominally bearish as price action is still unable to clear the downtrend from the August bubble like highs (upper black sloping line). The key is daily support to hold on at the 11500 point level and then push above 12000:
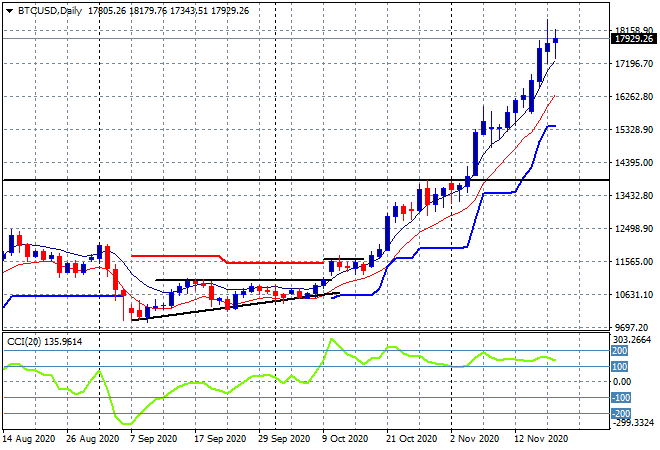
Bitcoin’s bubble like breakout still cannot be held back, but it only just made another new daily high and closing out just below the $18000 level which may have become temporary resistance as the FOMO trade fades out:
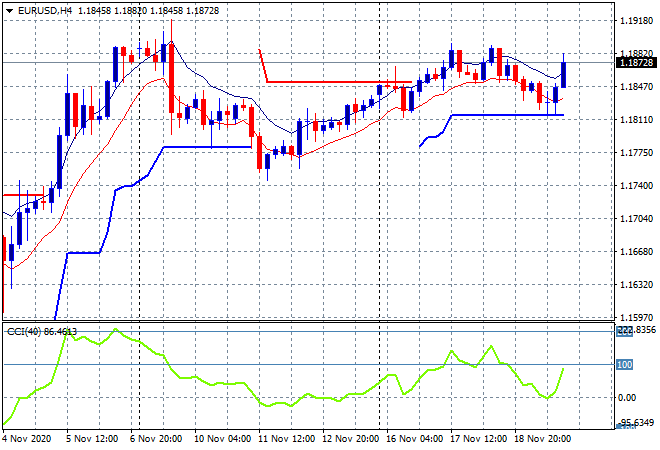
Currency markets are moving against USD with Euro breaking out late last night, almost matching its intraweek high at the 1.1880 level on the back of the slightly higher than expected US initial jobless claims. ATR support at the 1.18 handle proper has remained firmed this week but could be re-tested again shortly:
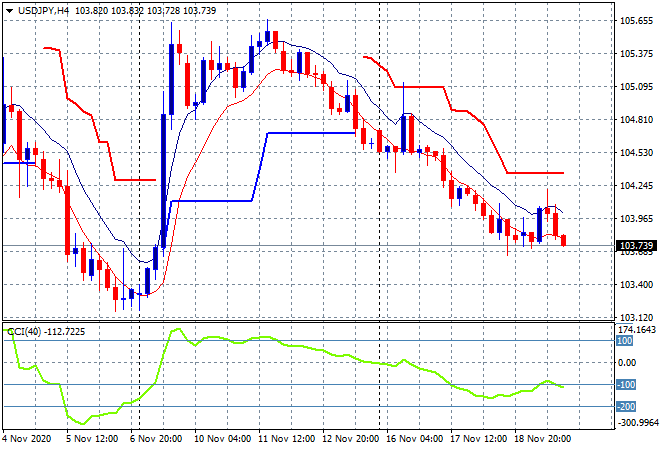
The USDJPY pair remains in a medium term downtrend, although it had a small reprieve yesterday it took all that back last night of the Fed’s call for more stimulus and has matched its previous intraweek low at the 103.70 level. The four hourly chart remains bearish with all signs of a return to the 103 handle soon:
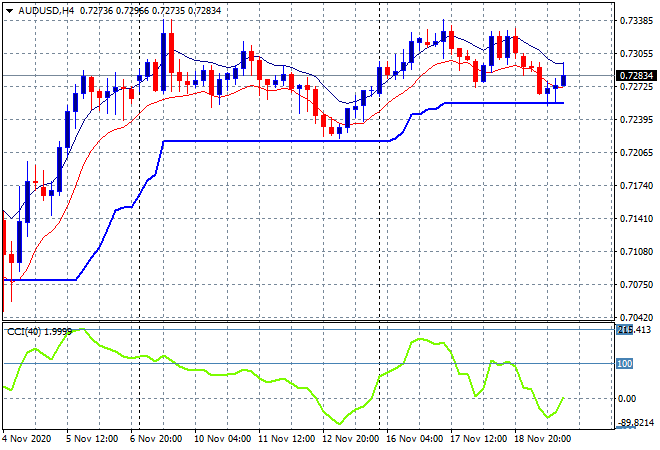
The Australian dollar is still holding on, having moved slightly lower on the unemployment print but bouncing off short term support to be back below the 73 handle overnight. Four hourly ATR support at the 72.50 level must here or this two week long sideways move will capitulate:
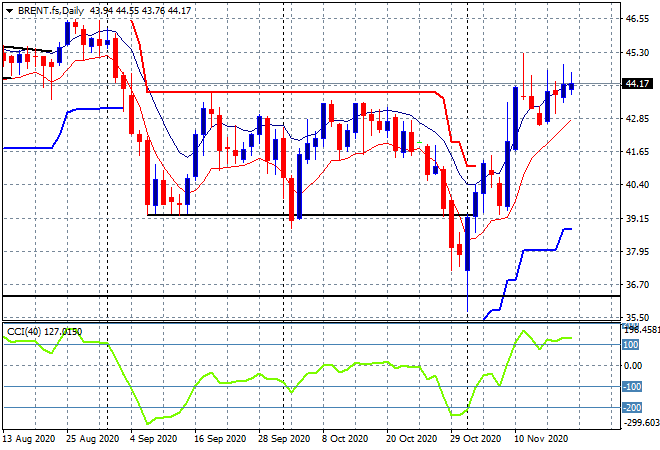
Oil prices are again rising ever so slowly but not without much authority with continued resistance right on the September/October points of control, with Brent remaining slightly above the $44USD per barrel level overnight. This is looking more and more like a short setup as long positions get exhausted:
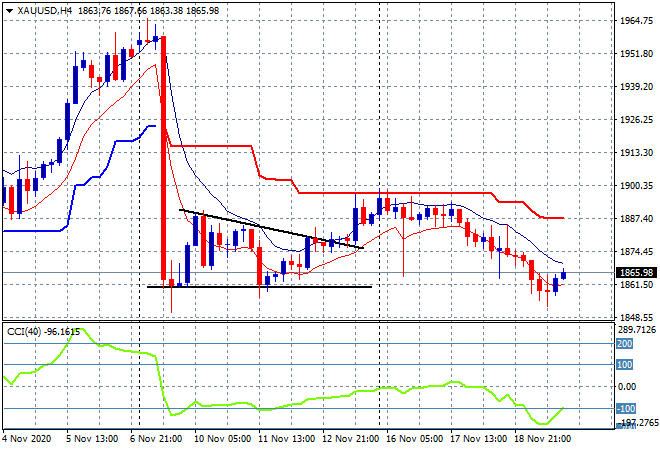
Gold had a minor reprieve overnight but its already fading, still unable to breach the $1870USD per ounce level. The four hourly chart shows terminal support at the $1860 level is the next target below:
Glossary of Acronyms and Technical Analysis Terms:
ATR: Average True Range – measures the degree of price volatility averaged over a time period
ATR Support/Resistance: a ratcheting mechanism that follows price below/above a trend, that if breached shows above average volatility
CCI: Commodity Channel Index: a momentum reading that calculates current price away from the statistical mean or “typical” price to indicate overbought (far above the mean) or oversold (far below the mean)
Low/High Moving Average: rolling mean of prices in this case, the low and high for the day/hour which creates a band around the actual price movement
FOMC: Federal Open Market Committee, monthly meeting of Federal Reserve regarding monetary policy (setting interest rates)
DOE: US Department of Energy
Uncle Point: or stop loss point, a level at which you’ve clearly been wrong on your position, so cry uncle and get out!