

Risk markets remain poised between hope and fear, illustrated last night when the news of the Pfizer vaccine increased efficacy was unable to repeat the previous positive reaction, while additional COVID economic measures saw Wall Street stumble at the close. The USD was able to claw back some losses while Treasury yields lifted again, despite better economic news on US housing starts. Gold and Bitcoin continue to battle it out amongst the alt-currency crowds with a $2000 volatile round trip on the latter highlighting the risks involved in playing with bubbles.
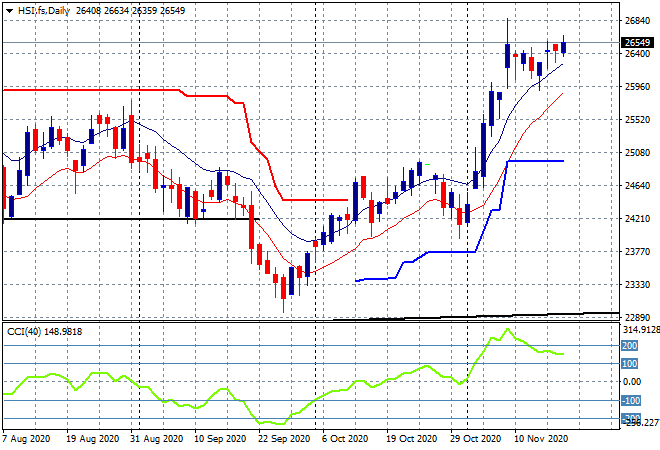
Looking at share markets in Asia from yesterday’s session where the Shanghai Composite was up throughout the day but fell going into the close, finishing up only 0.2% to 3347 points while in Hong Kong the Hang Seng Index was looking to put in another scratch session, but rallied at the close to finish up 0.5% to 26544 points. The daily chart is firming once again after looking very toppy here as momentum remains in overbought mode as daily price action is still sliding slightly higher, trying again to punch through resistance at the 26800 point level:
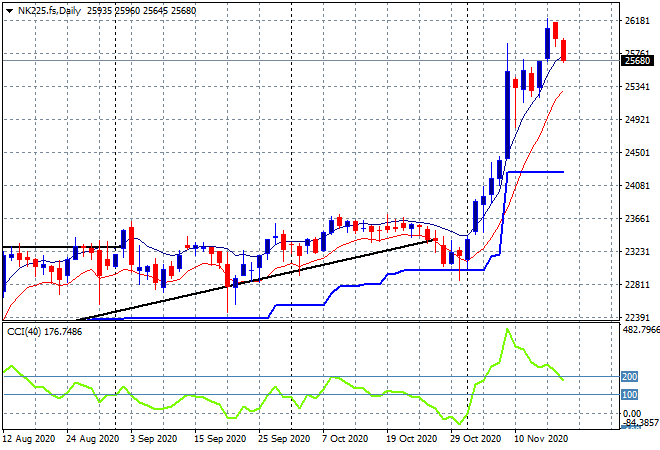
Japanese stock markets finally retraced somewhat with the Nikkei 225 falling back 1.1% to 26004 points. Futures are suggesting another pullback on the open this morning in line with the Wall Street late move as this market is way overextended and ripe for a proper retracement. I’m watching the 25300 point zone for signs of a breakdown:
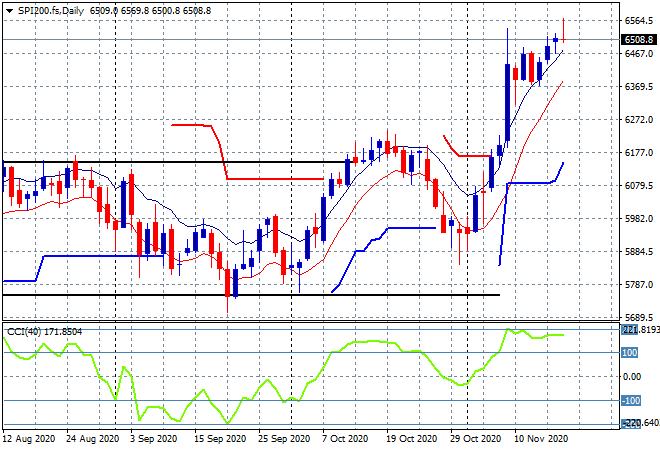
The ASX200 was the best in the region, gaining more than 0.5% to close at 6531 points. The daily chart is still a repeat of other equity markets with momentum well overbought so we would normally see a further pullback soon as SPI futures indicate a stall here, but again watch those session highs for another potential breakout above 6500 points:
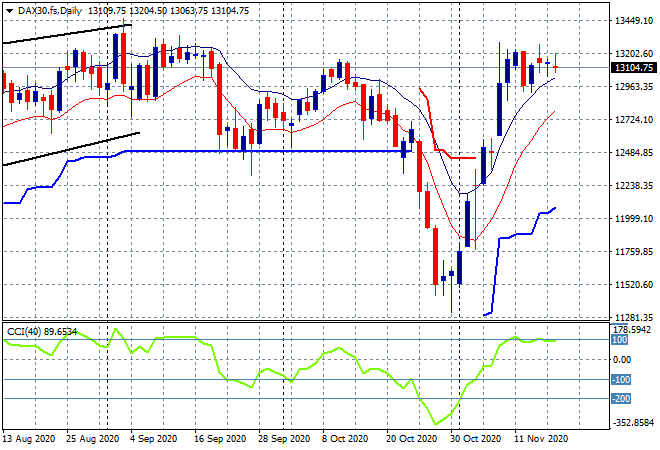
European markets had modest positive sessions as it builds on its good start to the week, with the German DAX gaining 0.5% to close at 13201 points. It gave up this and more on post close futures in line with Wall Street as the daily chart is still showing strong resistance at the August highs at just over the 13000 point level that can’t be beat:
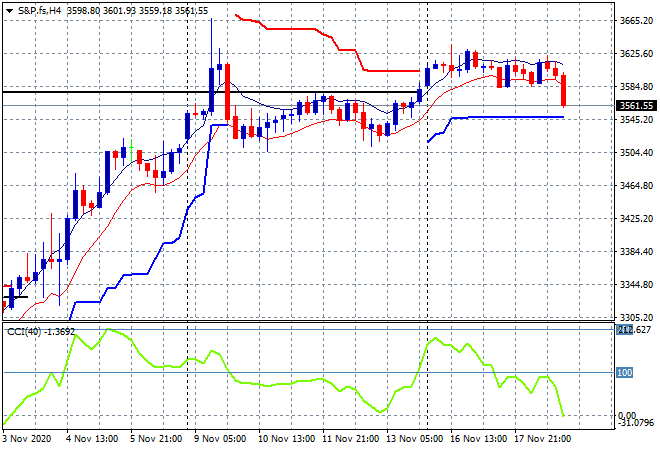
Wall Street wanted to push higher but found no momentum as the S&P500 sharply fell near to the close to finish 1.1% lower at 3567 points. The four hourly chart was showing a market ready to break higher but hesitation is turning into broader caution here as momentum nosedives and support at the 3500 point level comes into focus:
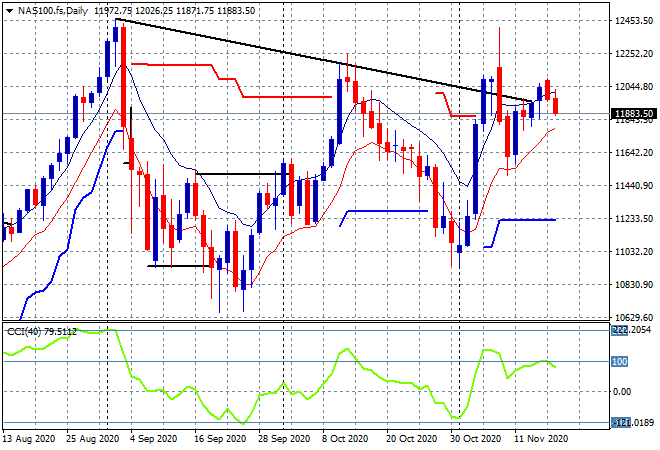
The NASDAQ had a similar result, falling 0.8% to close at 11801 points. The pattern on the daily chart remains nominally bearish as price action is still unable to clear the downtrend from the August bubble like highs (upper black sloping line). The key is daily support to hold on at the 11500 point level and then push above 12000:
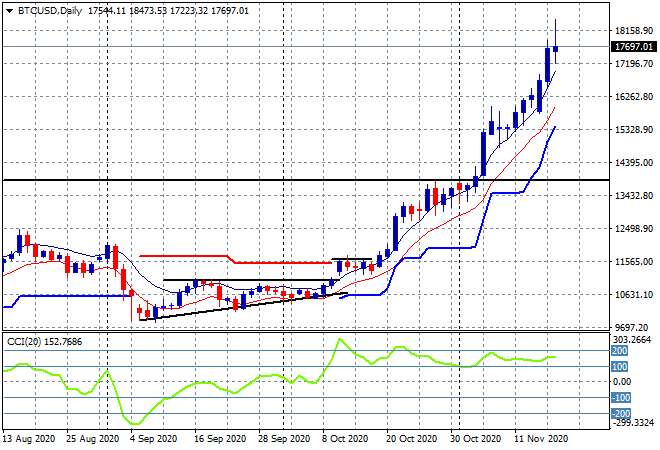
Bitcoin’s bubble like breakout still cannot be held back, just making another new daily high after a big $2000 round trip late yesterday afternoon (that was nicely traded thankyou very much!). Having broken $18000 its now on its way back to the $20,000 level it seems on the continued FOMO trade:
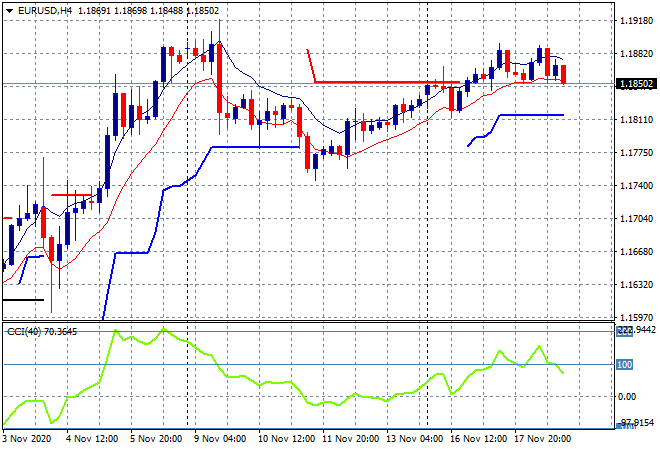
Currency markets are no longer moving around with Euro still unable to get through medium term resistance at the previous weekly high around the 1.19 handle, sliding sideways later in the session. The lowing moving average remains the area to watch in the short term:
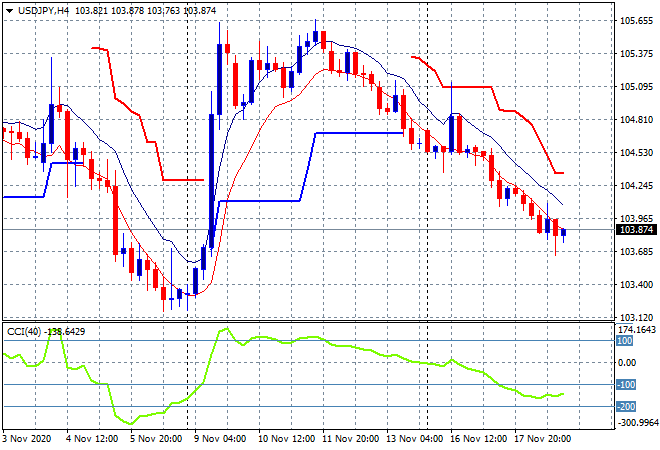
The USDJPY pair remains in a medium term downtrend, heading back below the 104 handle and clearly on its way back down to the previous weekly low just above the 103 level. The four hourly chart remains nominally bearish although momentum is now slightly oversold:
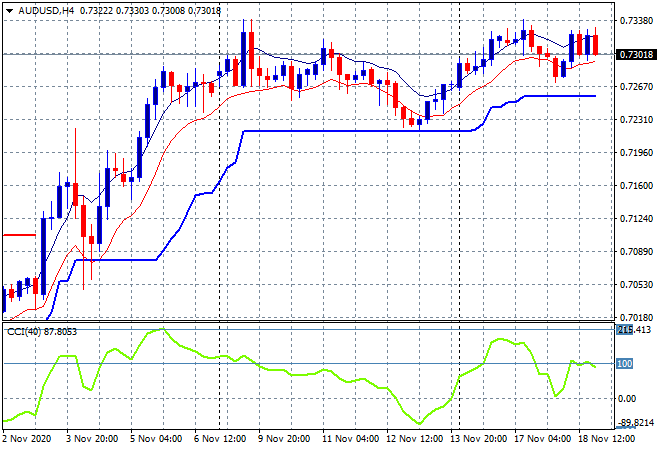
The Australian dollar is still holding on, having not moved much in the last 24 hours, still staying above the 73 handle overnight and matching the previous weekly highs. Four hourly ATR support is firming at the 72.50 level before today’s numberwang/unemployment print which needs to hold here:
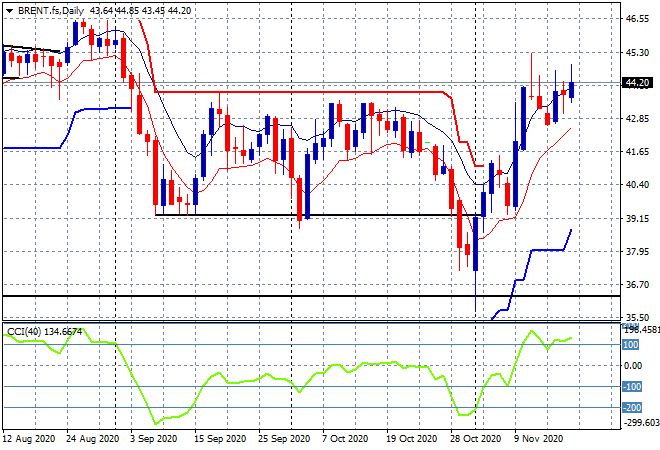
Oil prices are slowly rising but not without much authority with continued resistance right on the September/October points of control, with a move higher by Brent to be back above the $44USD per barrel level overnight. This is looking more and more like a short setup:
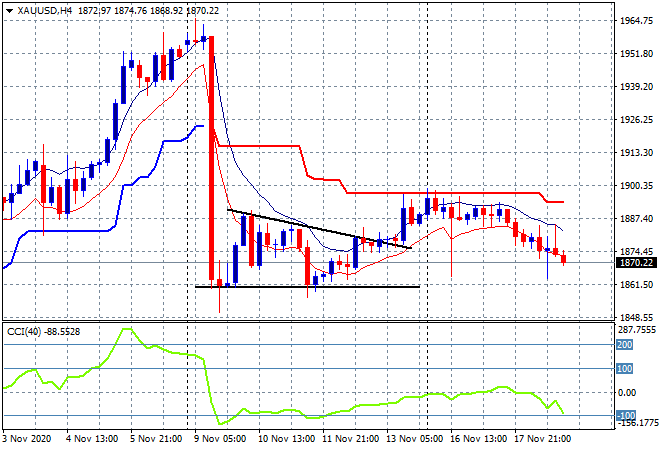
Gold is still licking its wounds, with another down session as Bitcoin becomes the darling, dragged down to the $1870USD per ounce level. The four hourly chart shows terminal support at the $1860 level is the next target below:
Glossary of Acronyms and Technical Analysis Terms:
ATR: Average True Range – measures the degree of price volatility averaged over a time period
ATR Support/Resistance: a ratcheting mechanism that follows price below/above a trend, that if breached shows above average volatility
CCI: Commodity Channel Index: a momentum reading that calculates current price away from the statistical mean or “typical” price to indicate overbought (far above the mean) or oversold (far below the mean)
Low/High Moving Average: rolling mean of prices in this case, the low and high for the day/hour which creates a band around the actual price movement
FOMC: Federal Open Market Committee, monthly meeting of Federal Reserve regarding monetary policy (setting interest rates)
DOE: US Department of Energy
Uncle Point: or stop loss point, a level at which you’ve clearly been wrong on your position, so cry uncle and get out!