

Risk markets returned to a state of hopium on Friday night despite the disaster unfolding in Europe and the US as COVID infections go off the charts. Following the expected retracement in wildly overbought stocks, Wall Street rebounded despite a falling consumer confidence print alongside PPI inflation. The USD lost a little ground while commodities where mixed as oil continued on its own pullback as demand is likely to drop over the Northern winter as economies go into further shutdowns, while gold hangs on precariously.
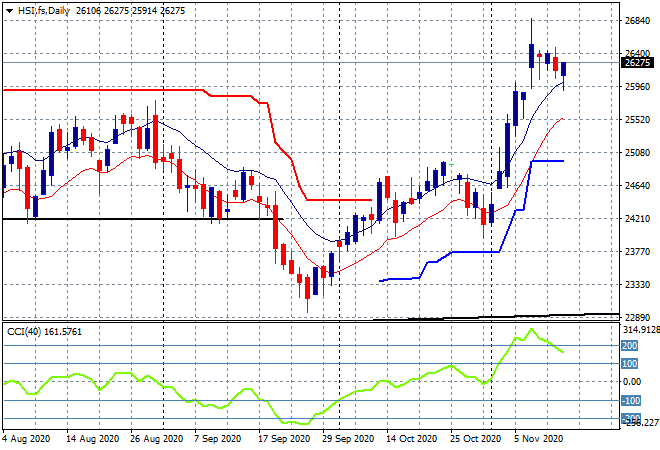
Looking at share markets in Asia from Friday’s session where the Shanghai Composite sold off fast again, closing nearly 0.9% lower to 3310 points while in Hong Kong the Hang Seng Index was able to get away with a scratch session after briefly looking below the 26000 point level. The daily chart is still showing a boisterous market with momentum slightly easing off from its recently extreme overbought mode and while daily price action is stalling here, I think there could be some stability in the starting sessions this week:
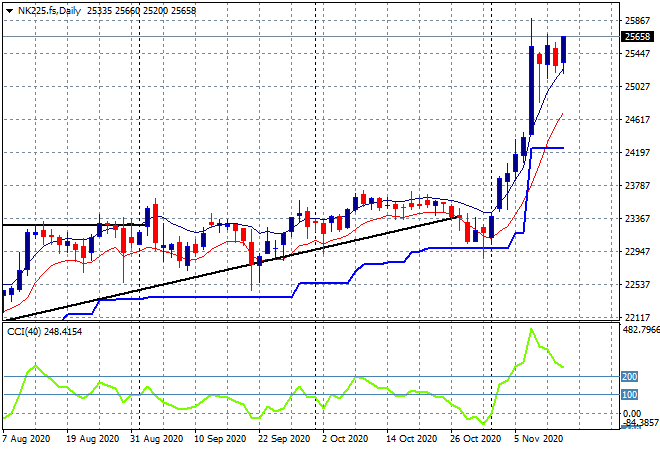
Japanese stock markets finally stumbled with the Nikkei 225 down nearly 1% before gaining at the close to finish only 0.5% lower to 25385 points. Futures are suggesting a surge on the open this morning in line with Wall Street fortunes even though this market is obviously way overextended and ripe for a retracement. USDJPY support is not correlated at all at the moment, so I’m very wary of this move:
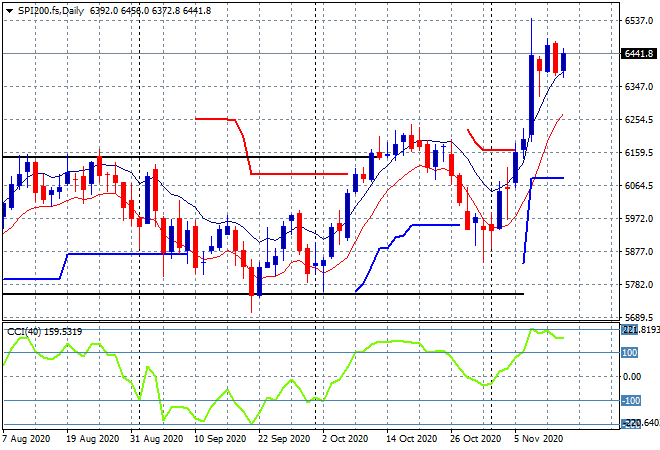
The ASX200 also continued its selloff, but was able to recover slightly going into the close showing more confidence about Friday night’s and the weekend session to only close 0.2% lower to 6405 points. The daily chart is a repeat of other equity markets with the big vaccine surge which turned into a topping action, then a retracement and now a hopium moment as risk goes ga-ga. Momentum remains extremely overbought so we would normally see a further pullback soon, but watch those session highs for another potential breakout:
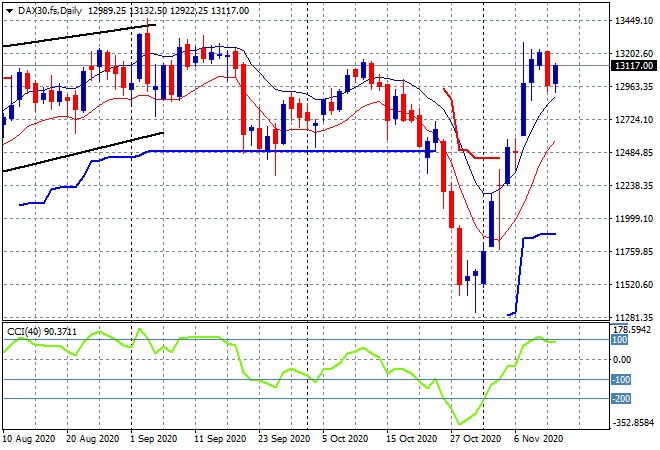
European markets had mild positive sessions throughout the continued as the post vaccine news retracement wore off, with the German DAX gaining 0.2% to close at 13076 points. The daily chart is still showing how strong resistance is at the August highs just over the 13000 point level where I think European traders will have their realisation moment this week – another February moment even?
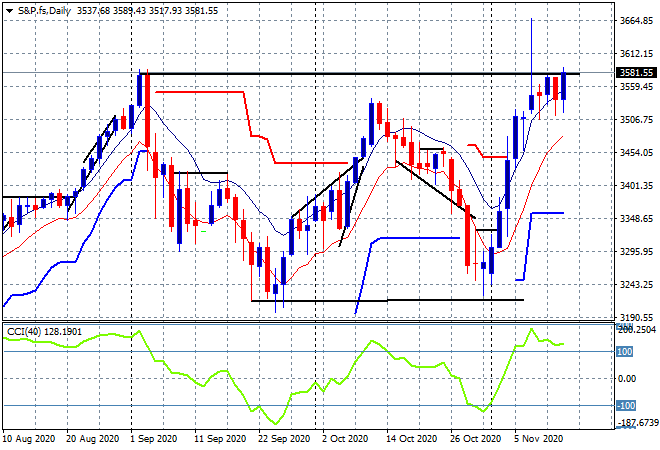
Wall Street was the one to disregard all economic, political and health concerns with a rally to push the S&P500 back to its late August high, finishing nearly 1.4% higher at 3585 points. The daily chart is showing a market ready to break higher and damn the torpedoes!
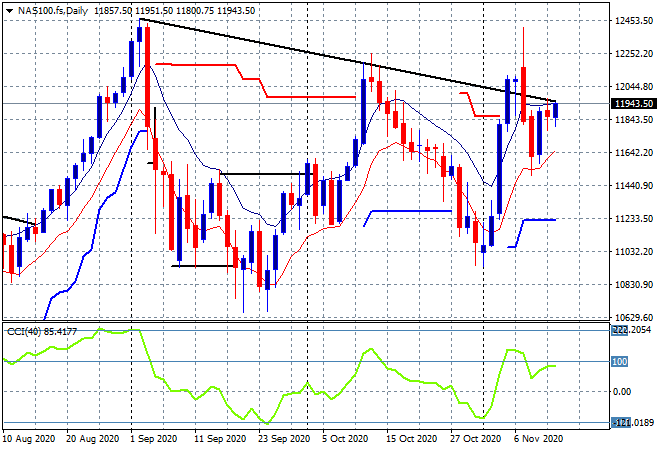
The NASDAQ was almost equally boisterious, claiming a 1% gain to finish the week at 11829 points. The pattern on the daily chart is still bearish as price action is still unable to clear the downtrend from the August bubble like highs (upper black sloping line). The key is daily support to hold on at the 11500 point level:
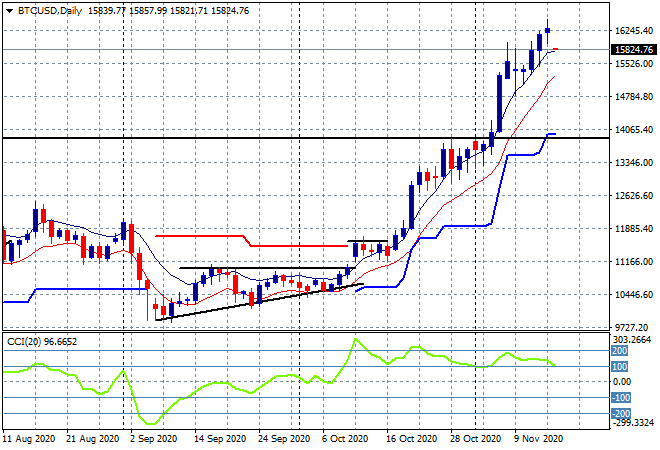
Bitcoin’s breakout is still re-surging to newer highs, having made yet another new daily high above the $16000 level. This is classic bubble psychology, having now risen over 40% since the breakout above $11000 in early October and looks like a nasty gap on the open here this morning:
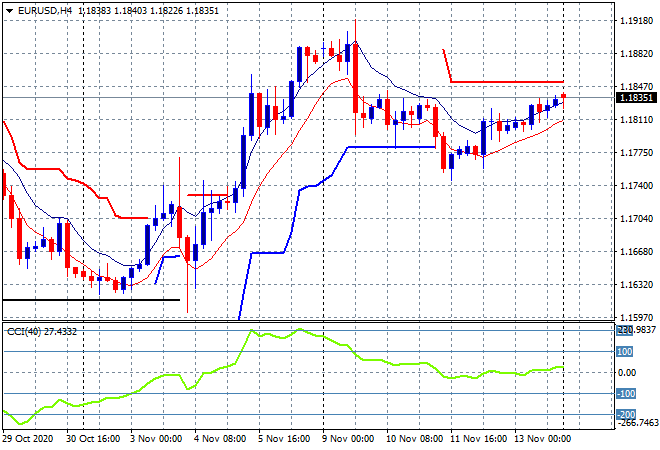
Currency markets were starting to move around following the mid week US CPI print and the post-vaccine news with the Euro able to further stabilise on Friday night to remain a little bit extended above the 1.18 handle. This still keeps it below short term resistance at the 1.1850 level with trailing ATR resistance on the four hourly chart the key area to watch for signs of a proper resurgence:
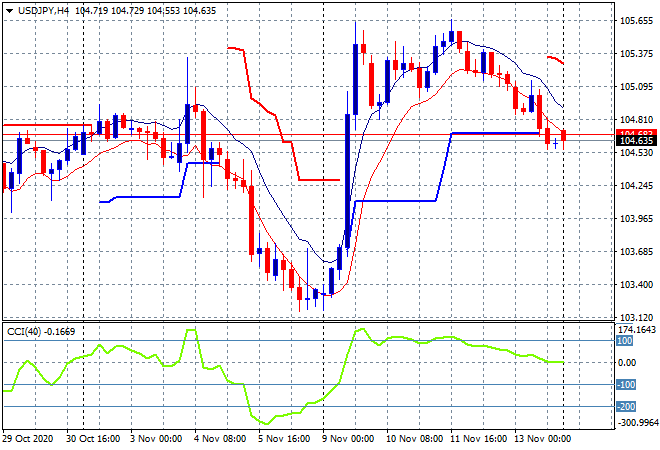
The USDJPY pair remained in rollover mode on Friday night, taking it back below the 105 level. This is a classic swing short play from an overbought level but where price action will steady is hard to discern with the possibility of further retracement evident on the four hourly chart back down to the 103 handle:
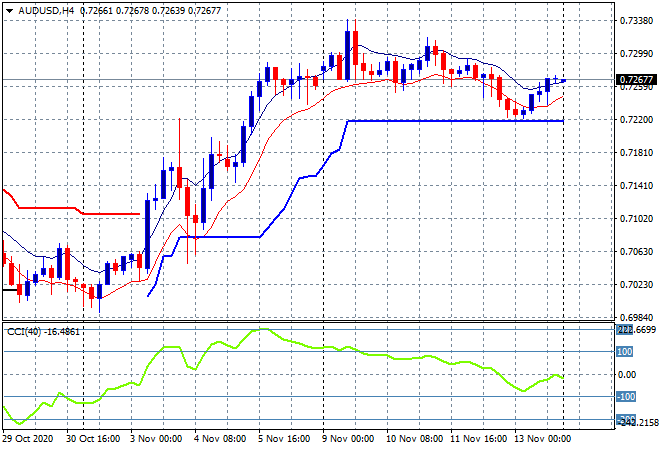
The Australian dollar was itself looking to move into the next stage of rollover, having broken below short term support that held all week at the 72.60 level, but was able to bounce off very short support, with momentum remaining negative on the four hourly chart for a weak finish to the week. Looking into this week’s price action, four hourly ATR support at the 72 handle proper must hold for another risk-correlated move higher:
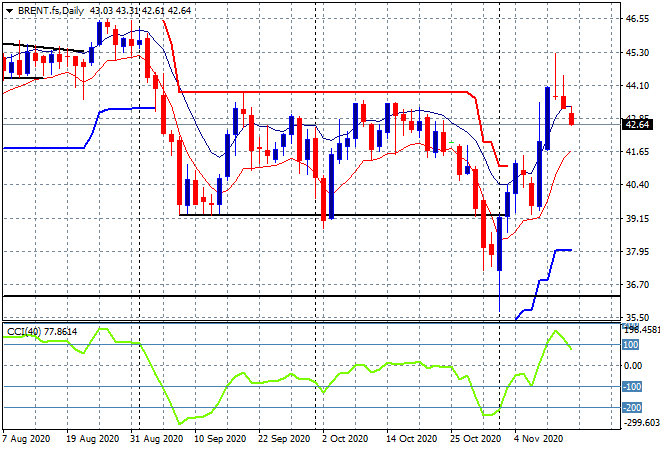
Oil prices are showing their hand here with significant and obvious selling pushing both markers down to the September/October points of control, with Brent pushed back below the $43USD per barrel level on Friday night. While price may try again to breakfree above the $44 level, I’m watching for more session lows as more short sellers step in:
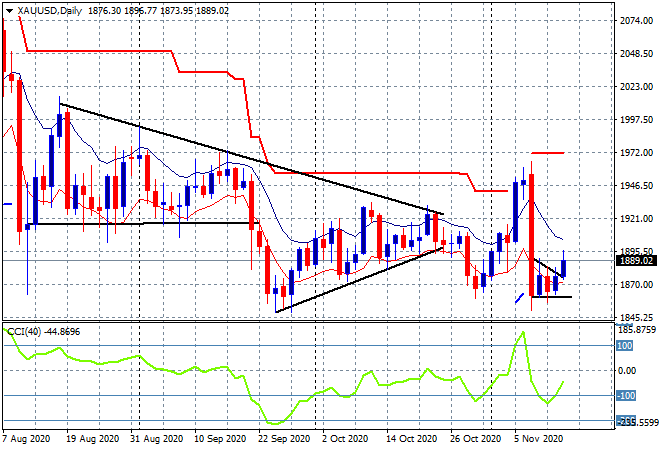
Gold is still licking its wounds, but was able to eke out yet another small gain on Friday, lifting another $10 or so to the $1889USD per ounce level. This doesn’t take it out of trouble as the daily chart is showing a market in a very weak state that is trying to build a bottoming pattern out of a horrid reversal post last week’s vaccine news slump, so for now watch terminal support at the $1860 level which must hold:
Glossary of Acronyms and Technical Analysis Terms:
ATR: Average True Range – measures the degree of price volatility averaged over a time period
ATR Support/Resistance: a ratcheting mechanism that follows price below/above a trend, that if breached shows above average volatility
CCI: Commodity Channel Index: a momentum reading that calculates current price away from the statistical mean or “typical” price to indicate overbought (far above the mean) or oversold (far below the mean)
Low/High Moving Average: rolling mean of prices in this case, the low and high for the day/hour which creates a band around the actual price movement
FOMC: Federal Open Market Committee, monthly meeting of Federal Reserve regarding monetary policy (setting interest rates)
DOE: US Department of Energy
Uncle Point: or stop loss point, a level at which you’ve clearly been wrong on your position, so cry uncle and get out!