

Stock markets were moderately positive overnight although a return to strength for USD dampened some risk expectations, alongside the massive surge in COVID cases in the US and Europe. Dovish comments from ECB members sent Euro down while the Australian dollar slipped slightly as commodities were mixed, gold particular which returned to its post vaccine news low.
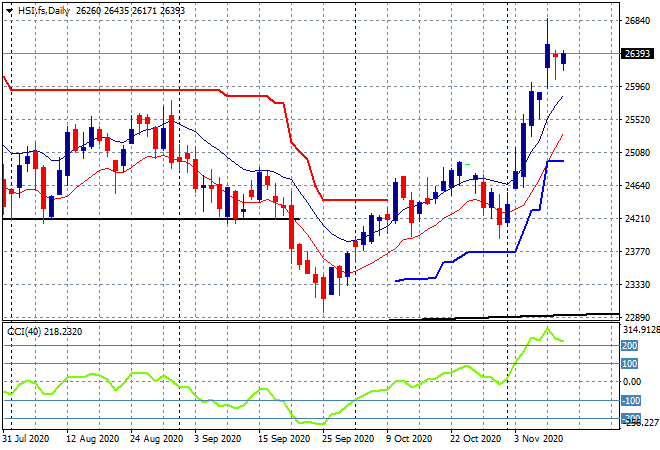
Looking at share markets in Asia from yesterday’s session where the Shanghai Composite dove in the last hour of trading, closing over 0.5% lower to 3342 points while in Hong Kong the Hang Seng Index followed in kind, closing 0.3% lower to 26226 points. The daily chart is still showing a boisterous market with momentum still nearly off the charts in extreme overbought mode. Daily price action is setting up the first stages of a stall here so watch for a retracement below the 26000 point level as a warning sign:
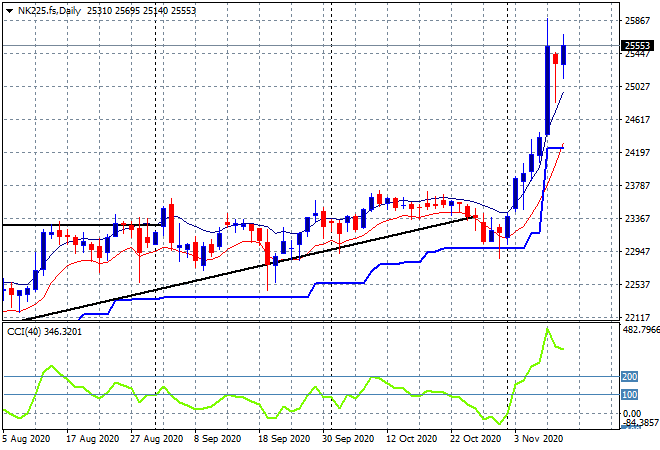
Japanese stock markets are picking up speed though with the Nikkei 225 closing 1.7% higher to 25323 points . Futures are suggesting a further advance on the open this morning in line with Wall Street fortunes even though this market is obviously way overextended and ripe for a retracement. I’d watch the high moving average at the 25000 point level proper for signs of a pullback, although it may not eventuate:
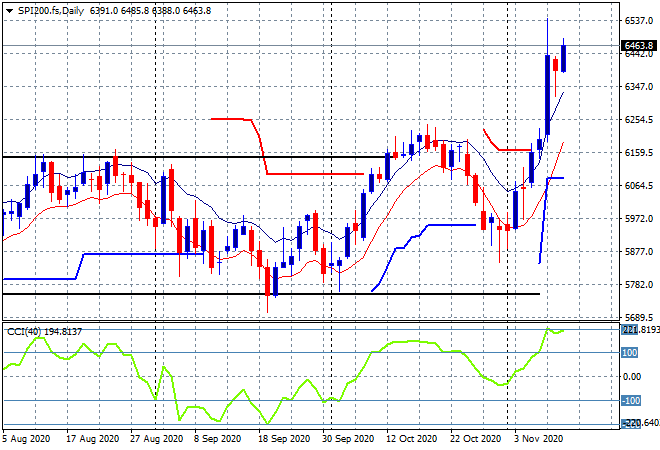
The ASX200 put in a much better session yesterday, climbing 1.7% higher to close at 6449 points, making the best level since late February before the COVID crash. The daily chart is a repeat of other equity markets with the big vaccine surge now resurging as traders throw caution to the wind. Momentum remains extremely overbought so we should see a small pullback soon, but risk can’t be pushed at the moment:
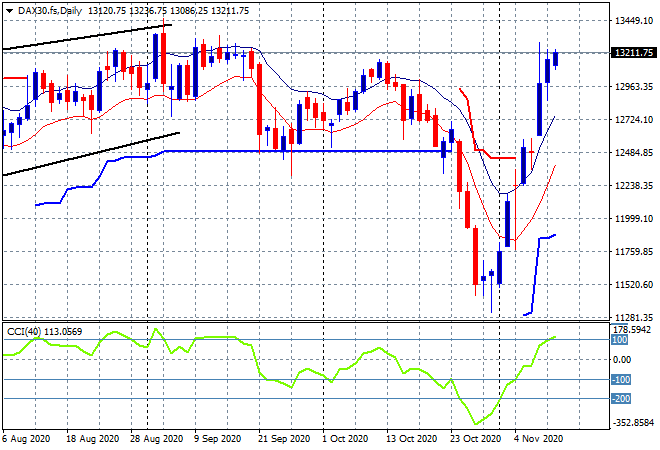
European markets continue to run on the hope theme too, helped by a lower Euro as the ECB talks the union currency down. The German DAX was the relative laggard, closing 0.4% higher at 13216 points. The daily chart is showing price basically at the August highs, having filled all of the October dip with momentum not yet in extreme overbought state despite the big rises of late. Can it hold on here or is resistance too great at the 13400 point level:
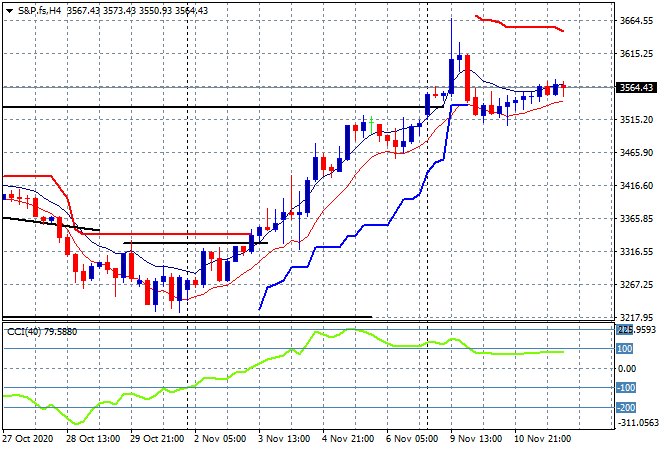
Wall Street took a deep breath following the Pfizer news and is still hesitant, albeit always bullish with the S&P500 finishing nearly 0.5% higher at 3564 points. The four hourly chart shows a market still wanting to lift higher but only just, keep watching for the 3500-3515 support zone to come under pressure soon, as it must hold:
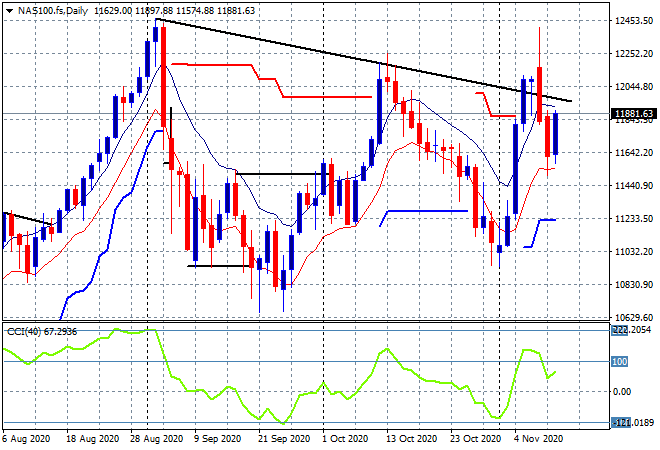
The NASDAQ finally put on a positive session, lifting by more than 1.7% to 11775 points overnight. The pattern on the daily chart remains bearish however as price action is still unable to clear the downtrend from the August bubble like highs (upper black sloping line). The key is daily support to hold on at the 11500 point level:
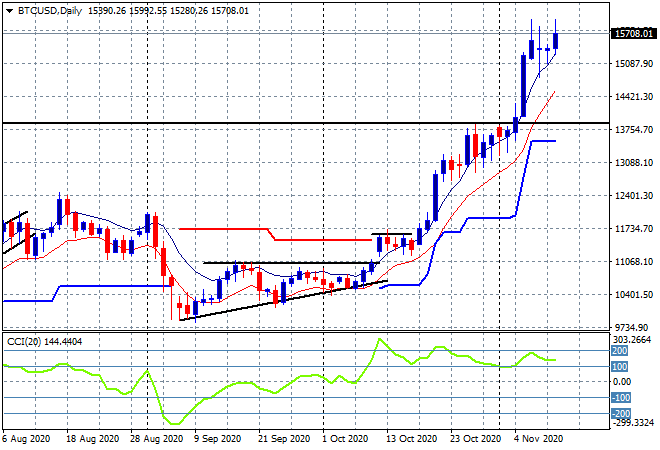
Bitcoin’s breakout is looking very much like equity markets and ready to re-surge to newer highs, having made another new daily high at the $15700 level. I still contend that longer term technical analysis indicate this could be the first stage of a new blowout – but Bitcoin is notoriously volatile (and manipulated) so we could see a violent retracement soon:
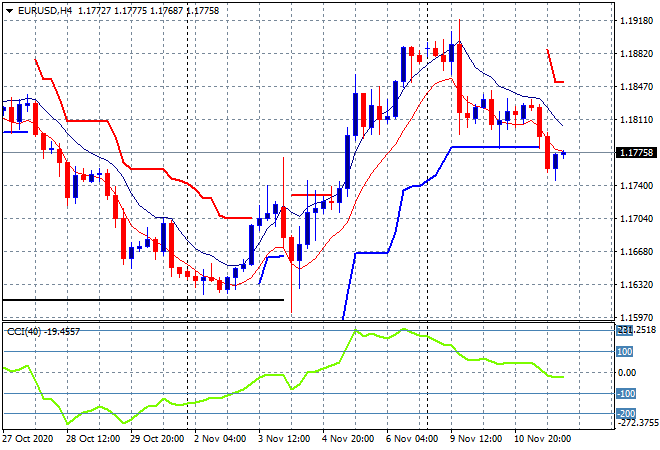
Currency markets are moving around a little more with USD strengthening against Euro which moved below trailing ATR support at the high 1.17’s last night in a negative funk following Lagarde’s dovish comments overnight. The union currency is ready to break further here, so watch the 1.1750 level to come under stress later tonight:
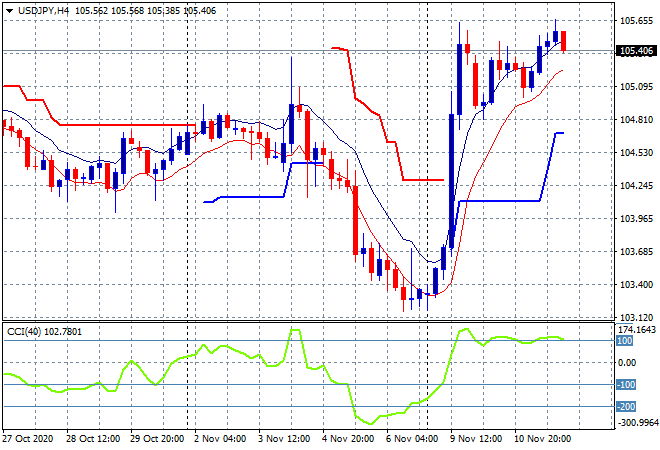
The USDJPY pair is trying to move out of its pause mode and follow other risk markets in making further gains post the vaccine news, with price action lifting beyond the previous point of control at the 105.30 level overnight. Momentum is still nicely overbought here but continue to watch that low moving average to be untouched going forward:
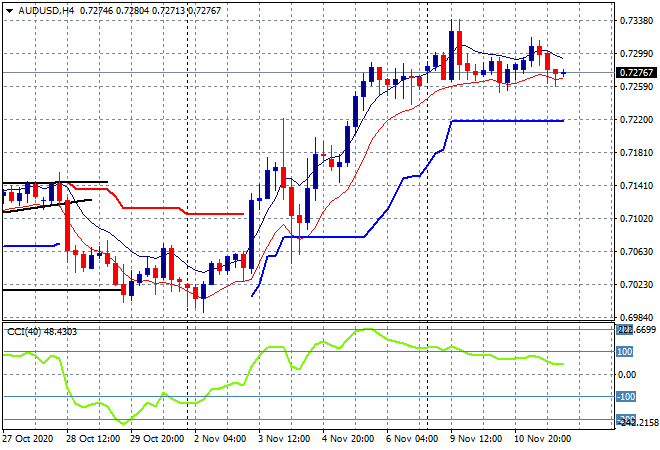
The Australian dollar likewise was unchanged, still holding on below the 73 handle in a very tight trading session again. The question remains if the medium term uptrend is sustainable so watch for the former weekly high at the 71.40 to act as firm support and the low moving average on the four hourly chart here at the 72.50 level as short term support/inflection:
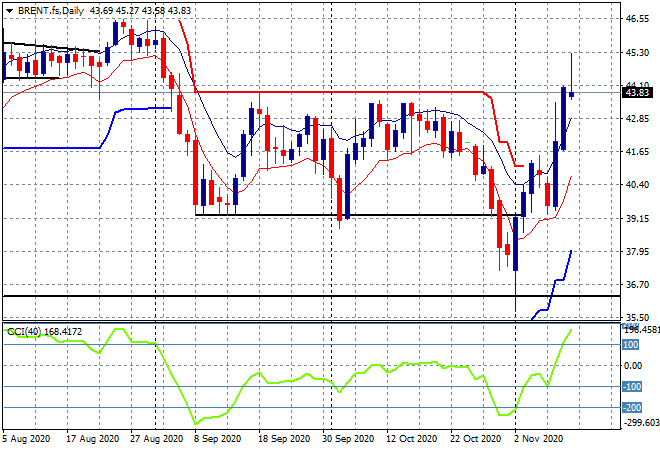
Oil prices tried to breakout substantially overnight but were knocked back with Brent still moving slightly above its September/October stalled highs at just below the $44USD per barrel level. The the key area to watch is that solid red line to the left – can it be sustainably breached for a proper uptrend as I questioned yesterday or will the short sellers keep stepping in:
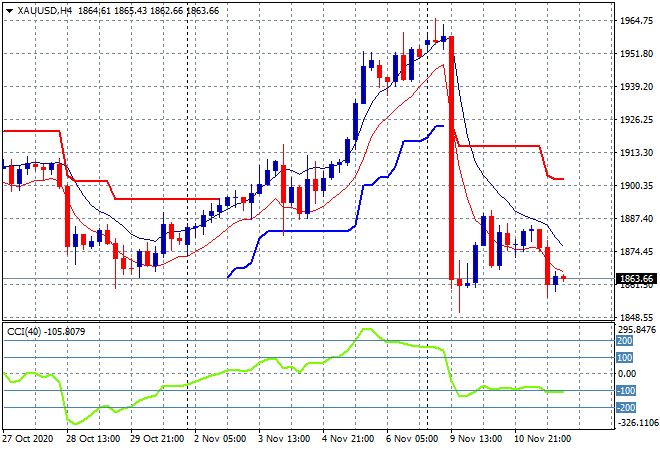
Gold is still licking its wounds, and was again smacked down overnight to match its previous session lows at the $1863USD per ounce level . The four hourly chart shows momentum still in an oversold stage with price barely hanging on above the October lows, where a new lower bottom is likely to be formed here before breaking again:
Glossary of Acronyms and Technical Analysis Terms:
ATR: Average True Range – measures the degree of price volatility averaged over a time period
ATR Support/Resistance: a ratcheting mechanism that follows price below/above a trend, that if breached shows above average volatility
CCI: Commodity Channel Index: a momentum reading that calculates current price away from the statistical mean or “typical” price to indicate overbought (far above the mean) or oversold (far below the mean)
Low/High Moving Average: rolling mean of prices in this case, the low and high for the day/hour which creates a band around the actual price movement
FOMC: Federal Open Market Committee, monthly meeting of Federal Reserve regarding monetary policy (setting interest rates)
DOE: US Department of Energy
Uncle Point: or stop loss point, a level at which you’ve clearly been wrong on your position, so cry uncle and get out!