

Stock markets stalled throughout the risk complex on Friday as the US election finally came to somewhat of a conclusion with Trump losing, while the better than expected and highly anticipated non-farm payrolls (aka US unemployment print) wasn’t able to push equities higher. Bond yields rose again while the USD continued its retreat alongside commodity prices as oil slumped. This week could see a lot of profit taking as the headline election results hides the fact that the US Senate will be logjammed again, spoiling any chance for either COVID relief and also the ridiculous 75 day delay between losing the election and kicking Trump out of the White House creating a few more months of uncertainty.
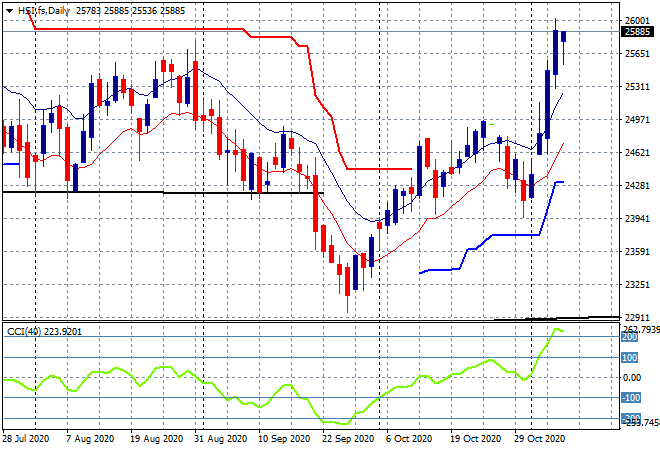
Looking back at share markets in Asia from Friday’s session where the Shanghai Composite fell fast towards the close, but recovered somewhat to be only 0.2% lower at 3312 points while in Hong Kong the Hang Seng Index put in a scratch session after its epic rise during the week, closing 0.1% higher at 25712 points. The daily chart shows this big surge bringing a lot of upside volatility to the technical picture with a new monthly higher as the lower USD helps accelerates the region on. As I said last week, this is wildly overbought and should retrace soon – look for any further falls below the recent daily session lows:
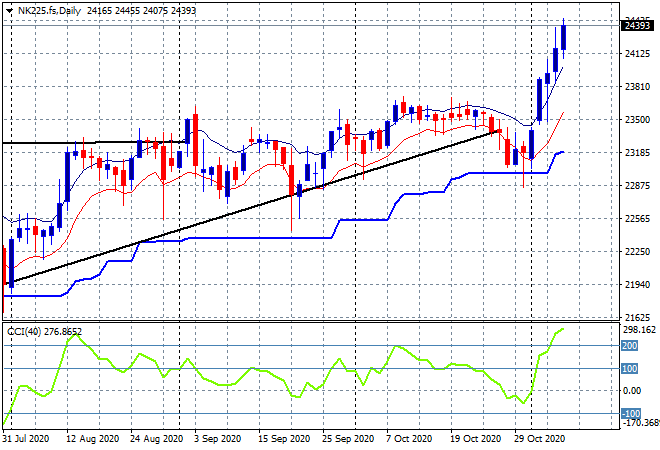
Japanese stock markets wanted to go higher though, with the Nikkei 225 closing up 0.9% at 24325 points for another weekly and monthly higher. Futures are suggesting more upside here on the open this morning despite a big drop in USDJPY on Friday that should be putting the dampeners on this way overbought market:
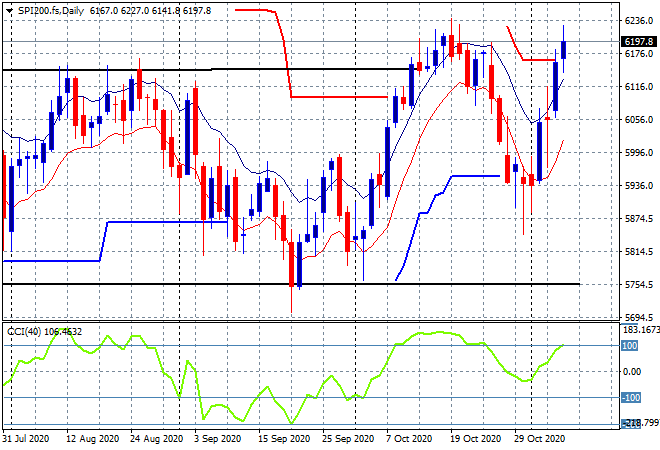
The ASX200 has finished the week with a very solid session, closing 0.8% higher to 6190 points. The daily chart is ready to breakout again here above 6200 points but this might be thwarted by the far too high Aussie dollar. Not yet overbought however so watch those former October highs to come under pressure soon:
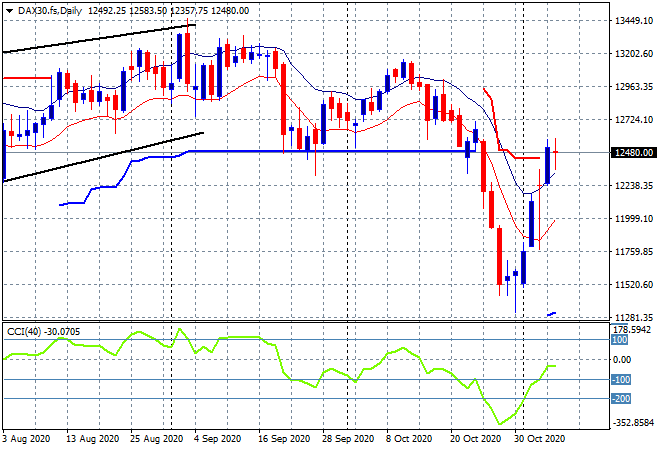
European markets put the breaks on another positive session as reality (and profit taking) set in, with the German DAX closing 0.7% lower at 12480 points. The daily chart is showing price wanting to clear the prebreakdown level at 12500 points but is still stuck here in what has only been a reflation trade so far. Momentum is not yet positive and I would keep stops tight here at the high moving average on any “unexpected” volatility:
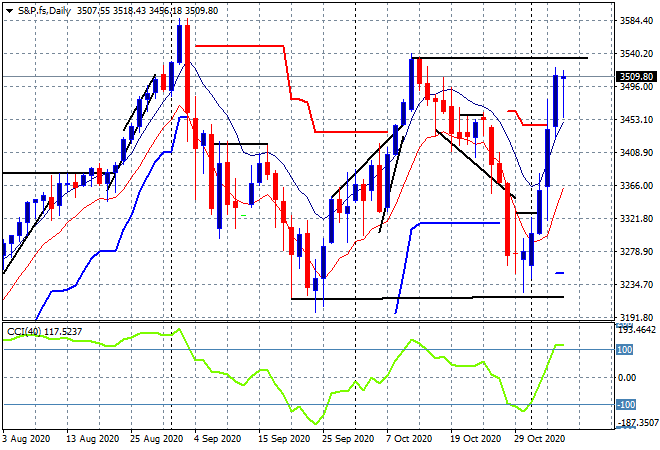
Wall Street also took a deep breath following the Biden victory and although a locked senate keeps its tax cuts safe the S&P500 finished dead flat at 3509 points, unable to beat its October highs. The daily chart shows a clear series of lower tops since the August highs – ripe now for an inversion particularly if Trump keeps rage tweeting and playing golf instead of conceding:
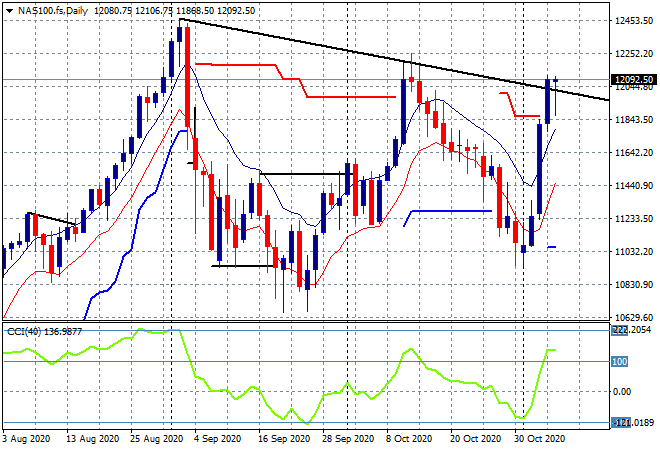
The NASDAQ was also equally unmoved, finishing the session where it started at 11895 points. Again, a similar pattern here on the daily chart where price action still needs to clear the downtrend from the August bubble like highs (upper black sloping line) with more authority, having only matched the October highs so far:
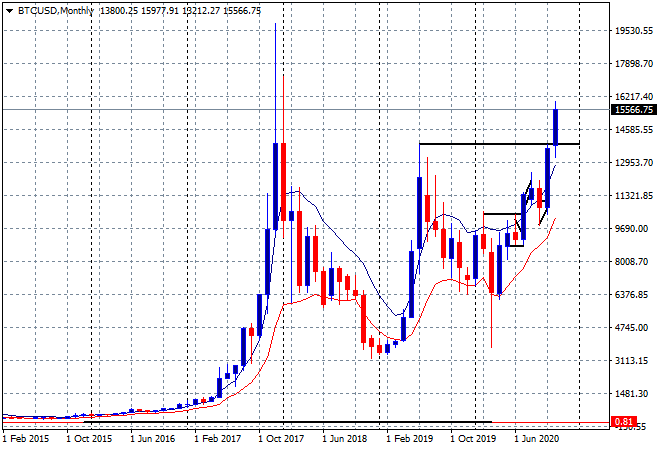
Bitcoin’s breakout is now pushing aside the $15000 level in a huge blowoff trade that now puts it back into the possible 2017 bubble highs – still off the nominal high of nearly $20,000, but longer term technical analysis does indicate this could be the first stage of a new blowout. Maybe $30,000 next?
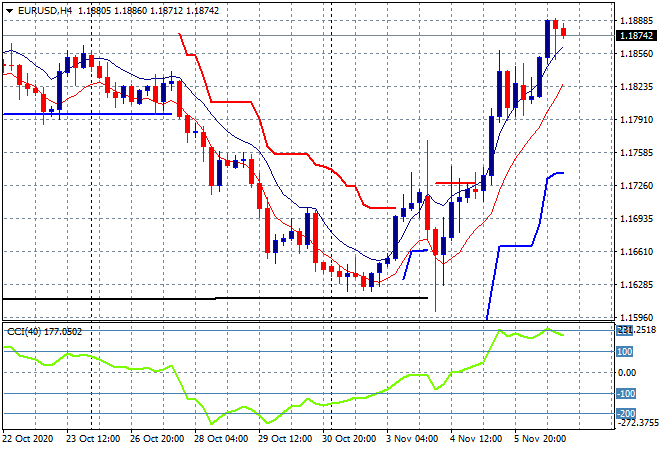
Currency markets are remaining anti-USD as Euro swings higher again to put pressure on the 1.19 handle, now pushing past the reflation trade on stock markets. The four hourly chart shows momentum at extreme levels which should normally setup a swing short trading situation in the near term, but the low moving average remains untouched:
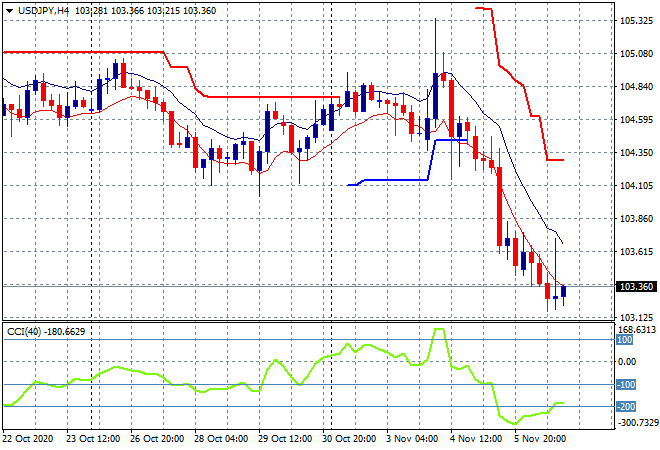
The USDJPY pair put in another losing session on Friday night, despite a small dip higher on the NFP print, it finished the week well below the 104 handle and made a new monthly low. While momentum has crossed over from extremely oversold to still heavily oversold – setting up the potential for a swing long trade – there is still no evidence of a bottom here on price action:
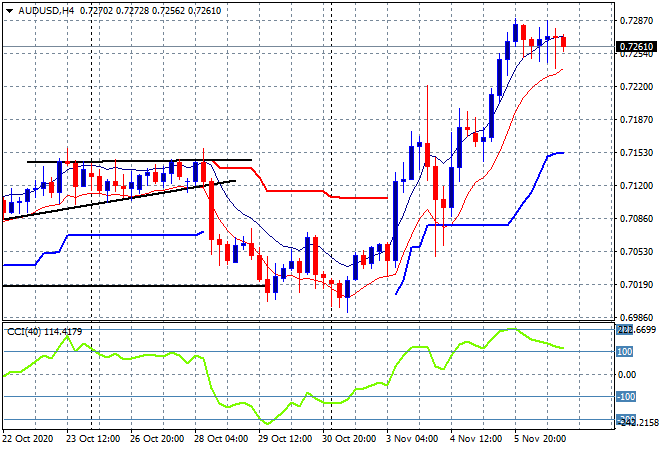
The Australian dollar had a pause just like equity markets on Friday night, holding on to its outsize gains as it remains well above the 72 handle amid the election volatility. The question remains is this sustainable so watch for the former weekly high at the 71.40 to act as firm support and the low moving average on the four hourly chart here at the 72.30 level as short term support/inflection:
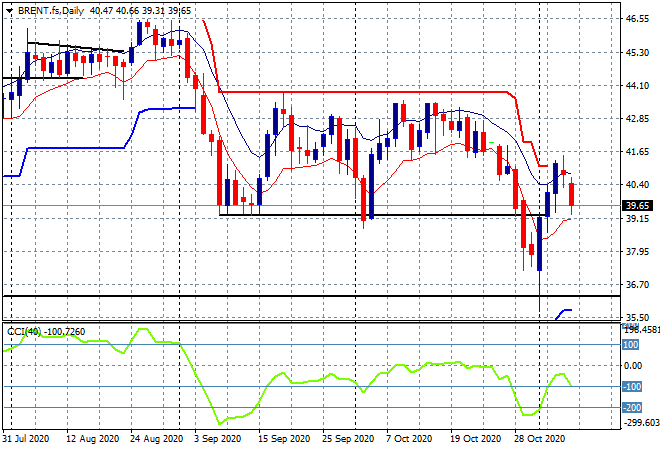
Oil prices retraced on Friday night with Brent falling sharply below the $40USD per barrel level. The daily chart was only showing momentum in a swing move last week, never with a positive reading as price was unable to clear the previous session highs. This could rollover again back down to $35:
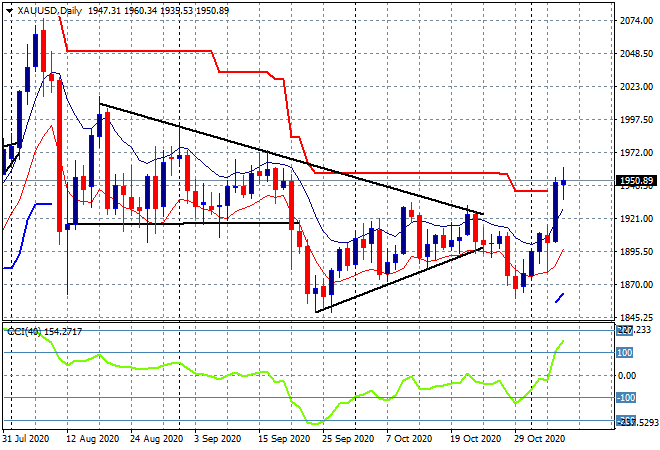
Gold is looking very promising now, having held on to its pre-election gains to finish the week just above the $1950USD per ounce level. The daily chart shows momentum nicely overbought and overhead resistance cleared all the way to the August/September holding period. It needs to gain above the $1975 zone soon to consolidate and this back into a proper medium or long term uptrend:
Glossary of Acronyms and Technical Analysis Terms:
ATR: Average True Range – measures the degree of price volatility averaged over a time period
ATR Support/Resistance: a ratcheting mechanism that follows price below/above a trend, that if breached shows above average volatility
CCI: Commodity Channel Index: a momentum reading that calculates current price away from the statistical mean or “typical” price to indicate overbought (far above the mean) or oversold (far below the mean)
Low/High Moving Average: rolling mean of prices in this case, the low and high for the day/hour which creates a band around the actual price movement
FOMC: Federal Open Market Committee, monthly meeting of Federal Reserve regarding monetary policy (setting interest rates)
DOE: US Department of Energy
Uncle Point: or stop loss point, a level at which you’ve clearly been wrong on your position, so cry uncle and get out!