
Stocks are loving the US election as Europe and Wall Street advanced overnight and continued to move higher in futures – a stark difference to the 2016 election. Treasury yields continue to move higher, the ten year now at 0.9% to almost a yearly high while USD is still in defensive mode, dropping against most of the majors. Oil prices continued their rebound alongside gold which cracked through the $1900USD per ounce level.
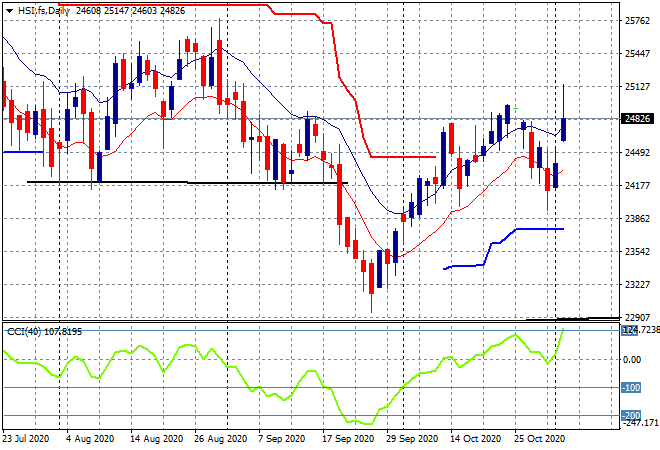
Looking back at share markets in Asia from yesterday’s session where the Shanghai Composite finally broke free, launching more than 1.4% higher to 3271 points while in Hong Kong the Hang Seng Index finished nearly 2% higher to 24939 points. The daily futures chart has seen a big gap higher, with a solid close above the high moving average, a clear sign of an upside breakout. However, price is not yet above the former highs at 25000 points, which needs to be cleared to call this a new trend:
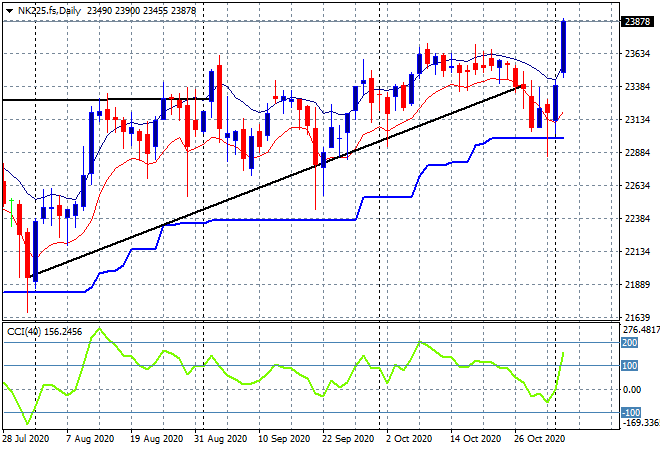
Japanese stock markets had yet another holiday with trading in Yen also muted. Futures are suggesting a big lift on the open this morning above very strong resistance at the 23700 point level as daily ATR support at the 23000 point level has held firm:
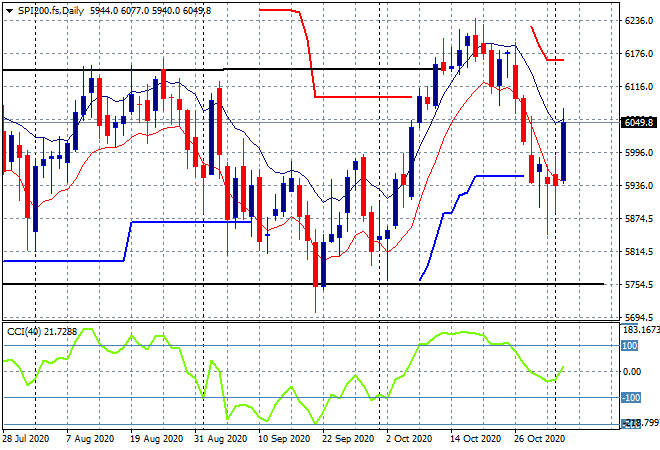
The ASX200 also managed a near 2% gain on the back of the RBA QE printing press starting up, closing at 6066 points. The daily chart is ready to re-engage here above 6000 points with a possible election bounce up to the 6200 point level, but this might be thwarted by the epic overnight ride in Aussie dollar following the RBA move:
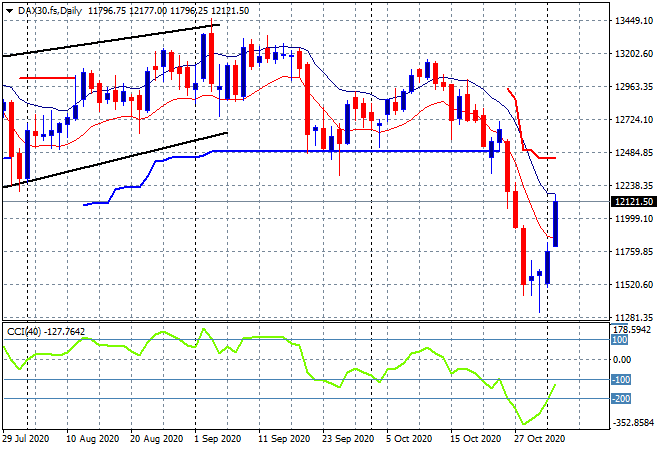
European markets had an extremely positive session on short covering with the German DAX closing another 2.5% higher to 12038 points. The daily chart is really putting in a bottom here with recent daily lows at the 11500 point level as momentum swings wildly from considerably oversold to try to get back to the prebreakdown level at 12500 points:
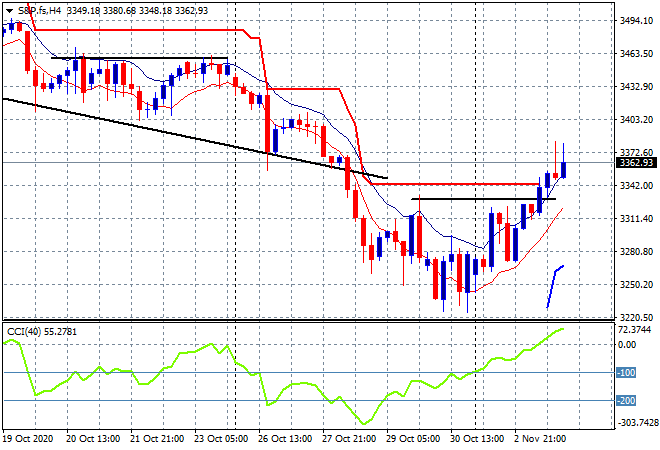
Pundits are still forecasting Wall Street betting on a Biden win with the S&P500 closing 1.8% higher to 3369 points overnight with futures extending those gains this morning. The four hourly chart is showing a lovely bottoming pattern here but there is concern this will get out of hand if election volatility mounts up – which it will:
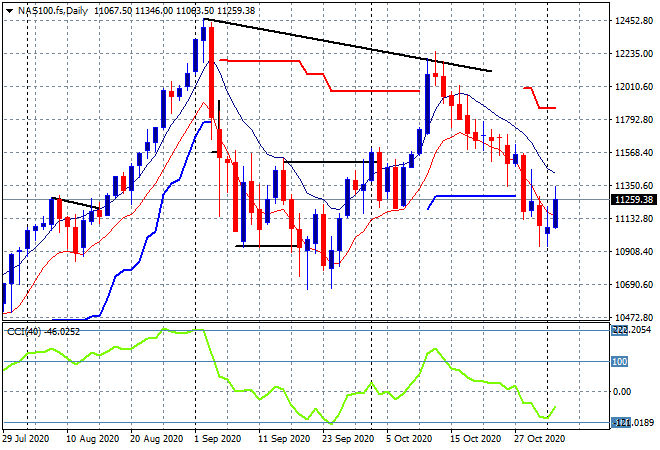
The NASDAQ is bouncing off its monthly and weekly lows, closing 1.8% higher in its first solid session in weeks, finally able to get back above the 11000 point level proper. I’m still watching for any close below 10900 points in the volatile week ahead:
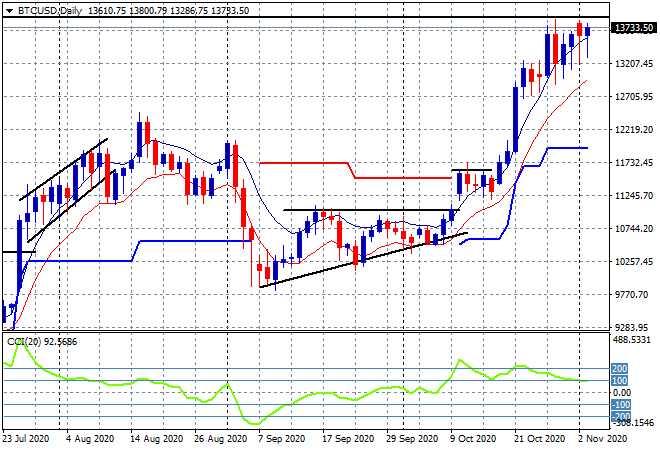
Bitcoin’s breakout is inching ever so higher to match the previous price high (upper horizontal black line) as it continues well above the $13000 point level, almost up to $14000. I’m still watching the low moving average as intermediate support here:
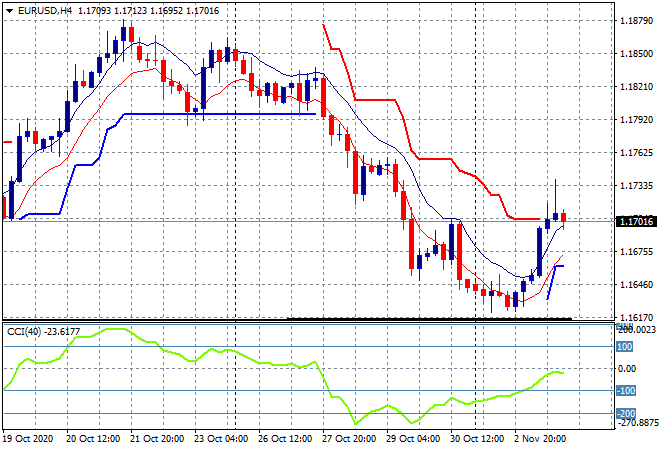
Currency markets are now coming back against USD with gusto as Euro swings higher to be back above the 1.17 handle after reaching another new monthly low. The four hourly chart was showing a potential deceleration here as it approaches the mid September lows with a big swing trade in concert with other undollar assets:
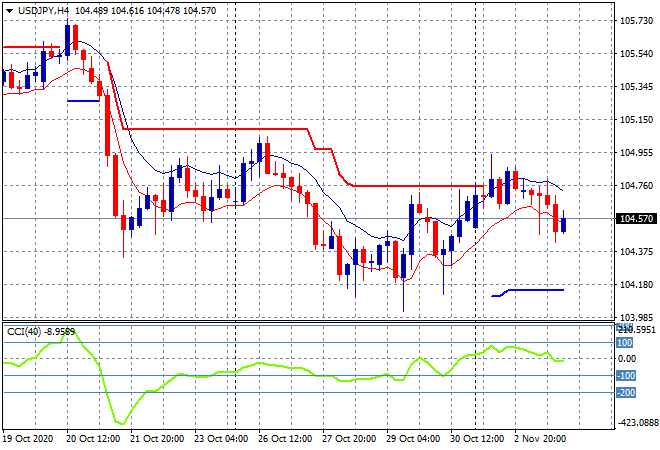
The USDJPY pair is feeling that pain with a rollover overnight giving up the pre-election gains as price was unable to significantly break above trailing ATR resistance on the four hourly chart. Momentum was never properly overbought and has flipped to partially negative so this could be forecasting further falls ahead back down to the 104 handle proper:
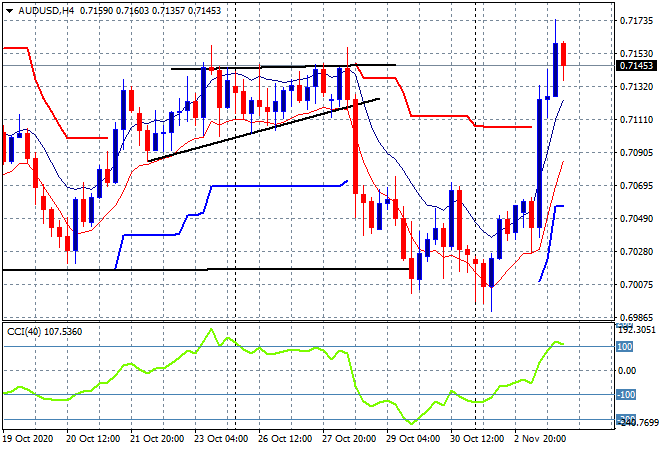
The Australian dollar was under enormous pressure to start the week but pent up volatility as commodities came back and the printing presses at Martin Place have seen an explosion overnight, pushing the Pacific Peso up over 120 pips to the mid 71’s. I was looking at the 70.70 level on the upside but this has been torched a new weekly high made in the process – can it go higher today:
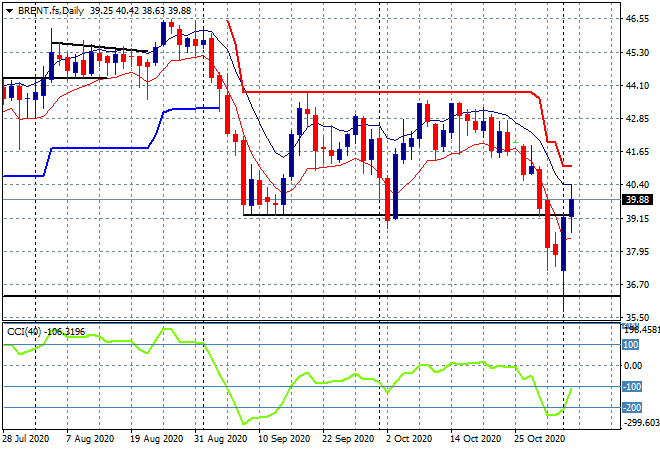
Oil continues to gain to the upside with Brent now almost back above the $40USD per barrel to start the new trading month with more hope after a breaking below the September lows. The daily chart is showing price now back above former support, now key resistance at the $40 level in a big reflation trade. Not unexpected, but can it be sustained as momentum is only in a swing reading for now:
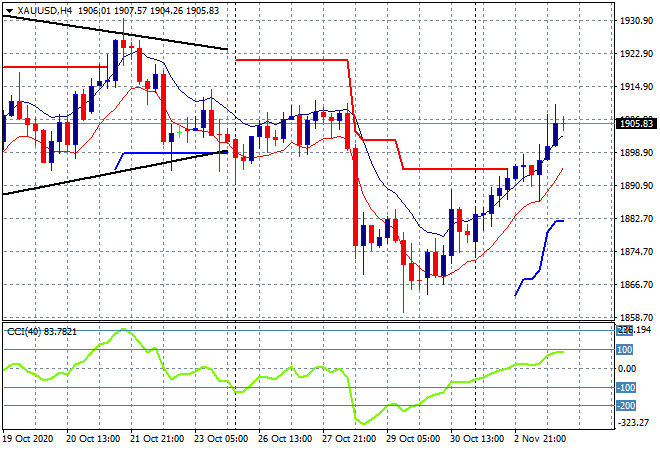
Gold continuities to to re-inflate here, finally getting back above the key $1900USD per ounce level overnight in an extended swing trade. The four hourly chart shows how this bounce has almost matched the previous week highs with momentum not yet overbought. As I stated previously, it would take a big reversal in USD fortune to see it touch the $1900’s again soon and here we are:
Glossary of Acronyms and Technical Analysis Terms:
ATR: Average True Range – measures the degree of price volatility averaged over a time period
ATR Support/Resistance: a ratcheting mechanism that follows price below/above a trend, that if breached shows above average volatility
CCI: Commodity Channel Index: a momentum reading that calculates current price away from the statistical mean or “typical” price to indicate overbought (far above the mean) or oversold (far below the mean)
Low/High Moving Average: rolling mean of prices in this case, the low and high for the day/hour which creates a band around the actual price movement
FOMC: Federal Open Market Committee, monthly meeting of Federal Reserve regarding monetary policy (setting interest rates)
DOE: US Department of Energy
Uncle Point: or stop loss point, a level at which you’ve clearly been wrong on your position, so cry uncle and get out!