

Risk is rebounding again in fits and spurts as volatility spikes before the US election with the USD losing ground against everything but Euro while Wall Street advanced – except tech stocks. More positive economic data with the latest ISM Manufacturing PMI print coming in hotter than expected, repeated in the EU and UK as well. Oil prices rebounded alongside gold while Treasury yields pulled back.
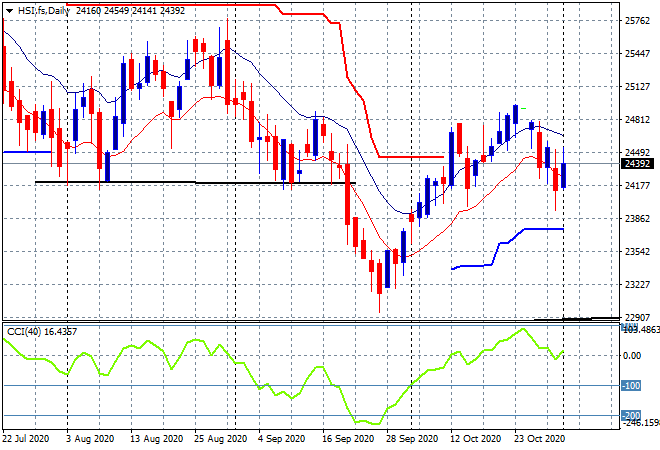
Looking back at share markets in Asia from yesterday’s session where the Shanghai Composite is again stuck with a scratch session, up only 0.1% to 3225 points while in Hong Kong the Hang Seng Index surged 1.5% to 24460. The daily futures chart was poised to break lower still as daily momentum flips to negative, but this has been thwarted with no new session lows, so watch for the high moving average to be broken soon on an upside breakout:
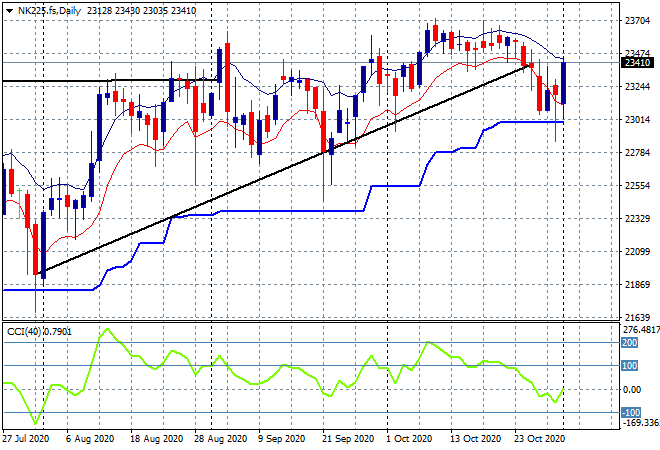
Japanese stock markets were boisterous too, with the Nikkei 225 closing nearly 1.4% higher to 23295 points. Price is firming at the daily ATR support at the 23000 point level and it must hold here to begin the long climb back above the broken trendline, with very strong resistance at the 23700 point level the target ahead:
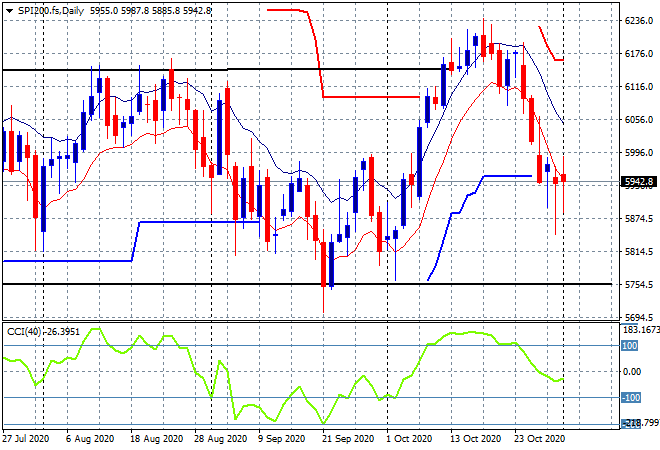
The ASX200 also moved forward, up 0.4% to 5951 points as traders factor in the triple whammy of the US election, Melbourne Cup and the RBA meeting in today’s session. The daily chart is quite poised here to expect some volatility with the upper and lower black resistance and support lines that I showed on the weekly chart yesterday revealing the real entry and exit points:
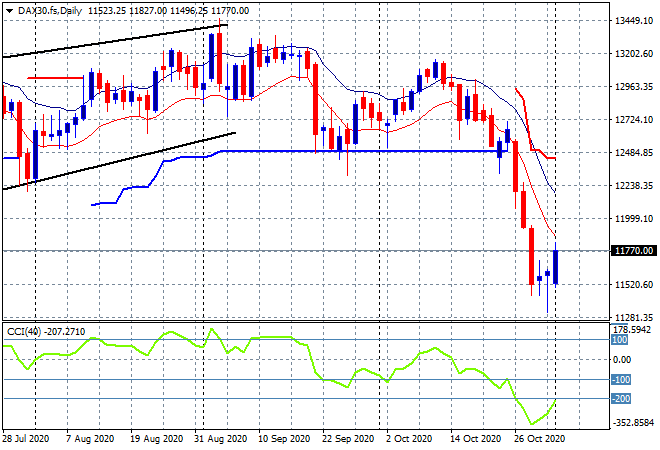
European markets had a very positive session on short covering in the wake of the final PMI prints and some hopium that maybe Biden can win against the anti-European Trump with the German DAX closing 2% higher to 11778 points. The daily chart is trying in vain to put in a bottom here with recent daily lows stuck at the 11500 point level – but momentum remains considerably oversold and not ready to swing back higher just yet:
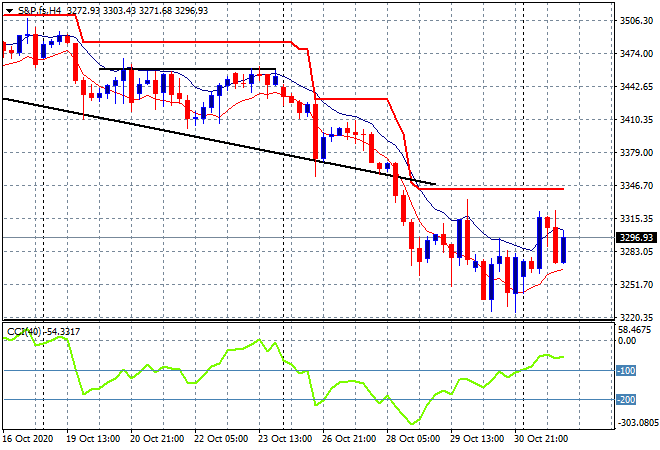
Pundits are reckoning that Wall Street is broadcasting a Biden win, but the technical charts say otherwise despite the S&P500 closing 1% higher to 3302 points overnight. The four hourly chart still shows a series of downtrends and failed breakouts at trailing ATR resistance at the 3350 point level remains the target to beat this week:
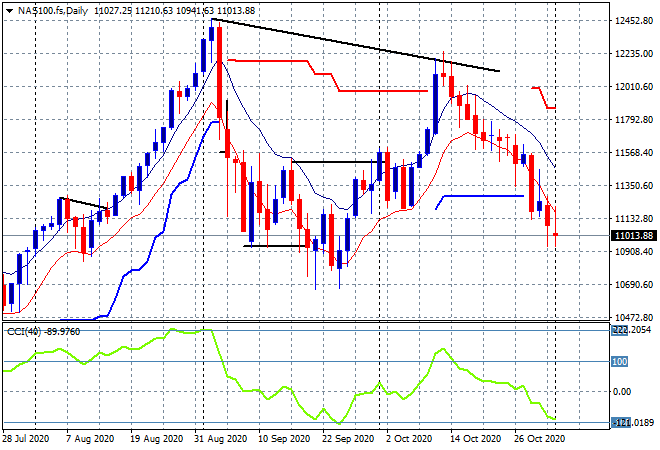
The NASDAQ is showing the true picture, closing only 0.15% higher at 10928 and unable to get back above the 11000 point level proper. This looks like an exhausted market and one that is broadcasting further falls. Watch for any close below 10900 points in the week ahead:
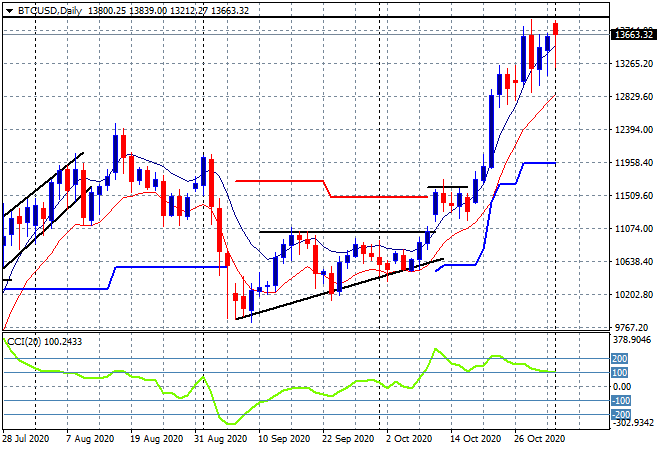
Bitcoin’s breakout is inching ever so higher to match the previous price high (upper horizontal black line) as it continues well above the $13000 point level. Can it breach it for further upside this week is the question – watch the low moving average as intermediate support here:
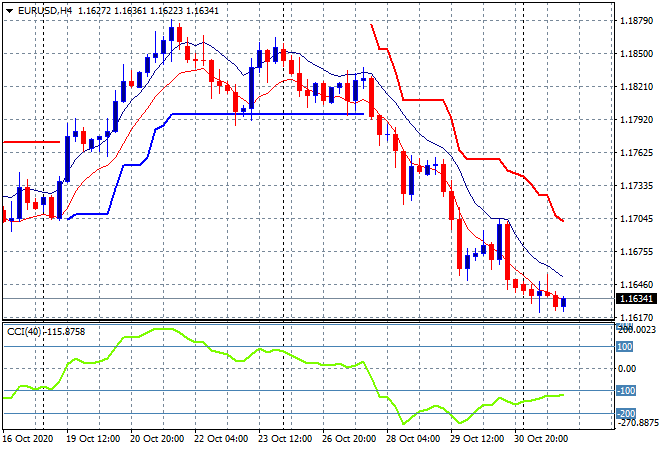
Currency markets are mixed with Euro remaining in the doldrums despite the good PMI prints, continuing to sell off below the 1.17 handle as it reaches another new monthly low. The four hourly chart does show a potential deceleration here as it approaches the mid September lows but there is potential for further lows in the wake of volatility and further shutdowns across the continent, let alone the US election worries:
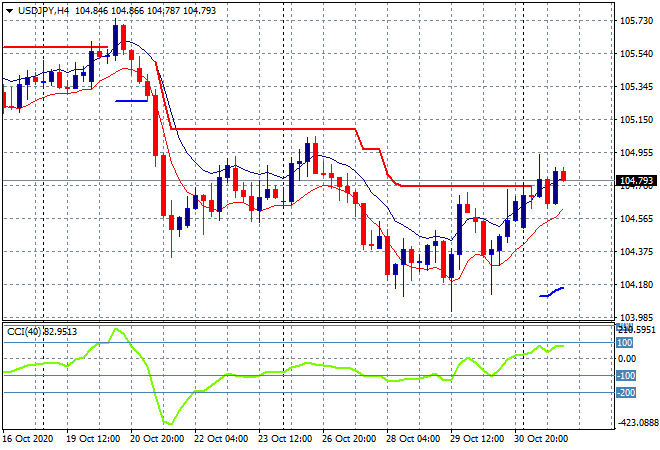
The USDJPY pair continues to firm here prior to the election with price heading above trailing ATR resistance on the four hourly chart, almost getting to a new weekly high in the process. Momentum is nicely poised here but not yet overbought so watch for further upside in today’s session, but be mindful that the medium term trend remains down and Yen safe haven buying could accelerate on any Trumpian shenanigans:
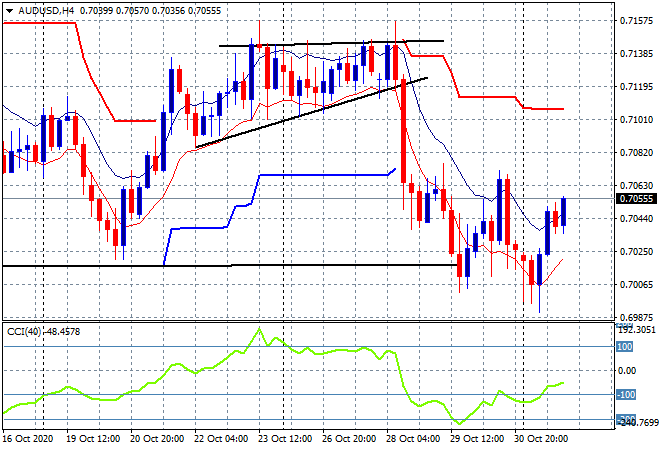
The Australian dollar was under enormous pressure to start the week but has recoiled because of that pent up volatility as commodities came back overnight, dragging the Pacific Peso back up to the mid 70’s. After recently crossing below the September lows and weekly support slightly below the 70 handle, there is potential for a rout to be avoided. Today’s RBA meeting may be crucial in terms of setting the medium term direction. Short term I’m looking at the 70.70 level on the upside:
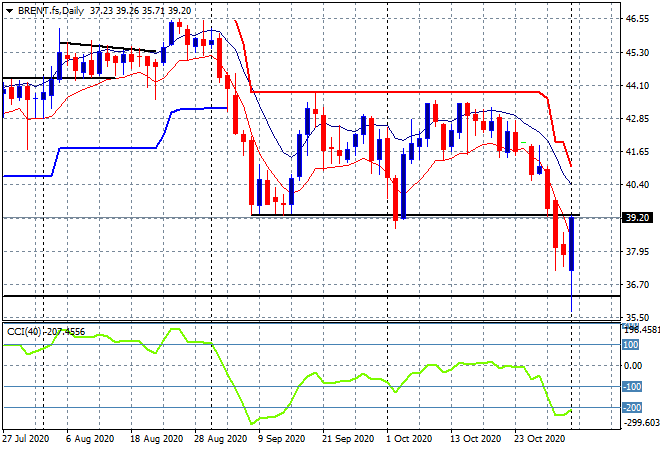
Oil volatility came back again but this time to the upside with Brent surging back above the $39USD per barrel to start the new trading month with more hope after a breaking below the September lows. The daily chart is still showing former support, now key resistance at the $40 level the area that must be broken to get back on track here or this might be the last hurrah before rolling over as Europe goes into lockdown and the US drives down the highway to hell:
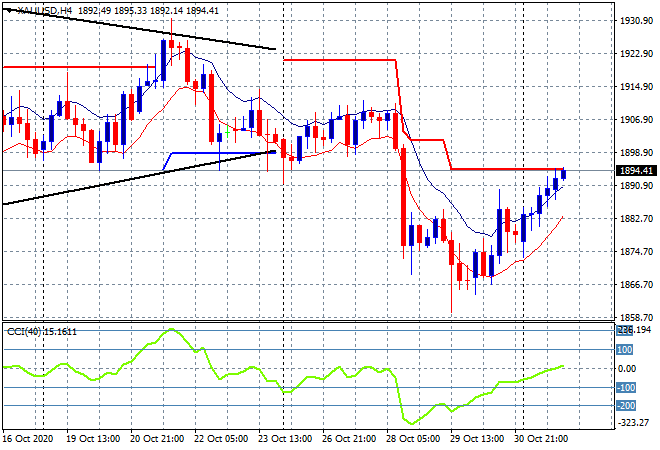
Gold really wants to re-inflate here, starting the week unexpectedly with a big surge, almost hitting the $1900USD per ounce level overnight in a nice swing trade. The four hourly chart shows the bounce off the September lows at the $1845USD per ounce level but as I said yesterday, it would take a big reversal in USD fortune to see it touch the $1900’s again soon:
Glossary of Acronyms and Technical Analysis Terms:
ATR: Average True Range – measures the degree of price volatility averaged over a time period
ATR Support/Resistance: a ratcheting mechanism that follows price below/above a trend, that if breached shows above average volatility
CCI: Commodity Channel Index: a momentum reading that calculates current price away from the statistical mean or “typical” price to indicate overbought (far above the mean) or oversold (far below the mean)
Low/High Moving Average: rolling mean of prices in this case, the low and high for the day/hour which creates a band around the actual price movement
FOMC: Federal Open Market Committee, monthly meeting of Federal Reserve regarding monetary policy (setting interest rates)
DOE: US Department of Energy
Uncle Point: or stop loss point, a level at which you’ve clearly been wrong on your position, so cry uncle and get out!