

So begins what could be the most volatile trading week of the year as the US election finally comes to a hand. Risk markets retraced once again on Friday night, capping off a poor week for stocks and undollar assets like the Australian dollar and gold. The backdrop was some good economic data from the US, with personal consumption expenditure (PCE) and consumer confidence figures much higher than expected while EZ wide 3Q GDP was also better, although annualised GDP growth remains deep in the red as unemployment also fixed and not getting any better on the continent.
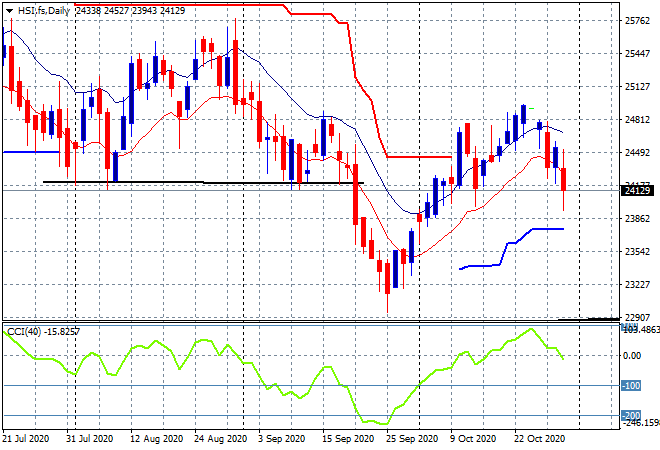
Looking back at share markets in Asia from Friday’s session where stocks were cruising along until the final hours brought about deep selling across the region. The Shanghai Composite was heading for a scratch session, then suddenly dived to finish 1.5% lower at 3224 points while in Hong Kong the Hang Seng Index suffered a similar fate, eventually closing nearly 2% lower to 24107 points. The daily futures chart is now poised to break lower still as daily momentum flips to negative, and for falls to be arrested we have to see no more lower session lows:
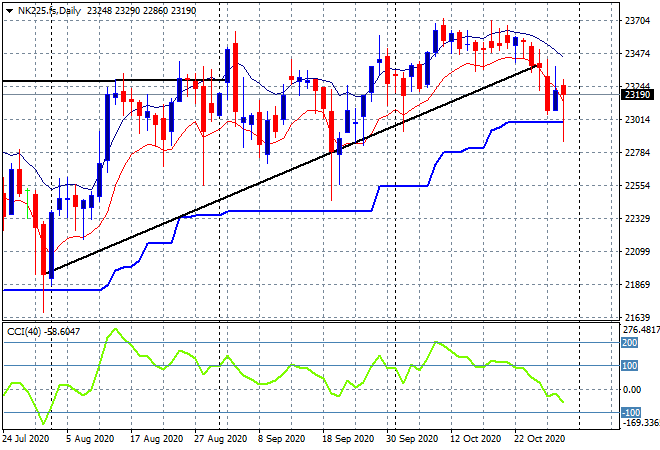
Japanese stock markets lost ground fast in the afternoon session, with the Nikkei 225 off by more than 1.5% to 22977 points. Price was firming at the daily ATR support at the 23000 point level but this breach is quite telling as momentum dives off into the negative zone and as the broken trendline spells trouble ahead:
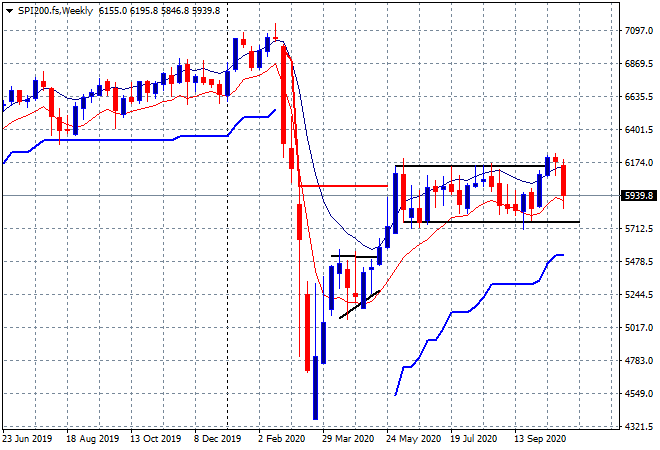
The ASX200 was the best off, relatively speaking, only falling 0.5% to close the week out at 5927 points. Switching to the weekly chart you can see how the market is poised here with daily support at the 6000 point level now slowly turning into a second band of resistance below the 6150 weekly level. The boxing in of price here is pretty clear – enact hedges when price action starts to go south of 5700 points:
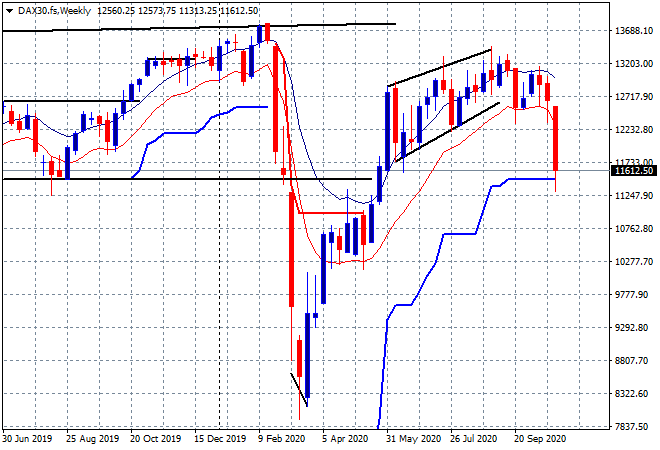
European markets eventually finished a volatile session with a variety of scratch sessions and minor bounces with the German DAX closing only 0.3% lower to 11556 points. The weekly chart is looking very ominous to say the least as the winter lockdown looms, and I still contend its on the way to the 11000 point level if it doesn’t hold here at the 11500 point level:
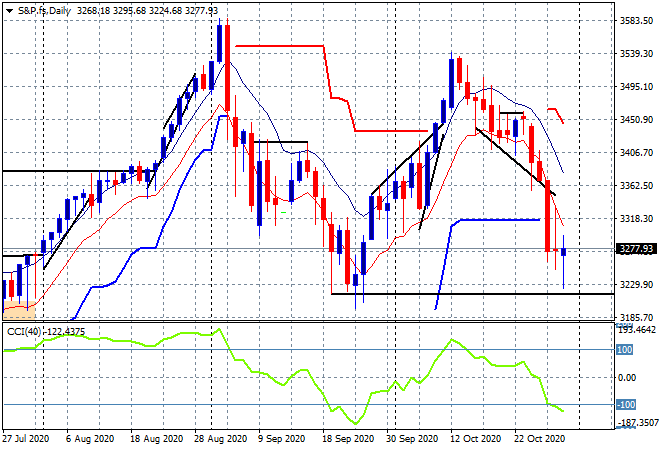
Wall Street was unable to be positive in the wake of the better than expected economic prints with the S&P500 closing 1.2% lower to 3269 points. The daily chart shows a series of exhales of exhaustion going into this week’s election with support at the 3220 point level from the September lows the key uncle point that must hold:
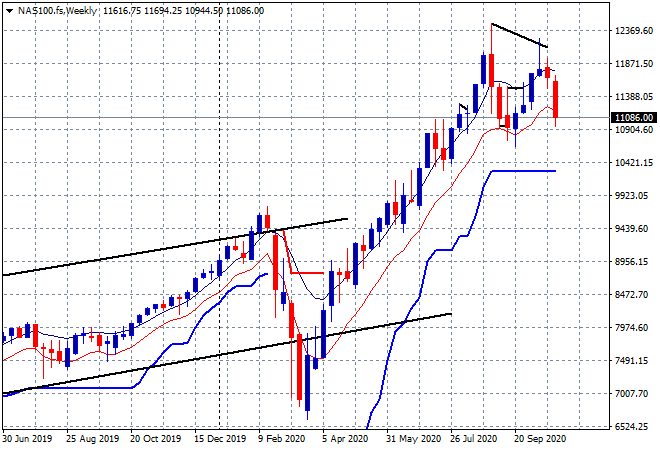
The NASDAQ was hit harder on Friday, losing over 2% to finally close below the 11000 point support level at 10911 although it just snuck in with a lift above that level in post-close futures. The weekly chart shows that similar exhaustion point with the potential to break and hit trailing support at the 10000 point level proper. The inflection will be any close below 10900 points in the week ahead:
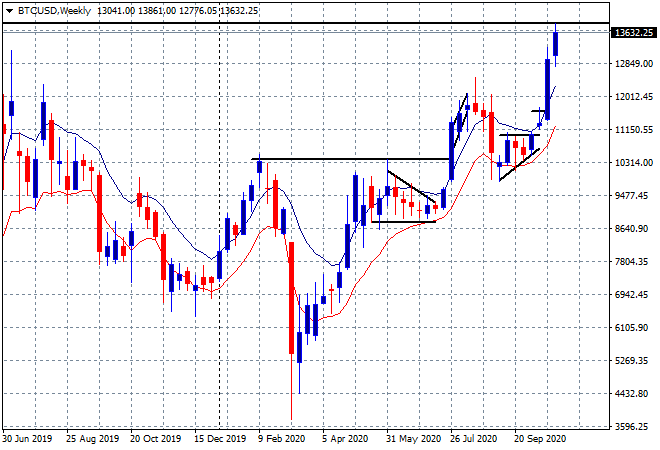
Bitcoin’s breakout is still going as it matches the previous price high (upper horizontal black line) well above the $13000 point level. Can it breach it for further upside this week? A little overdone technically speaking, but nothing is off the table:
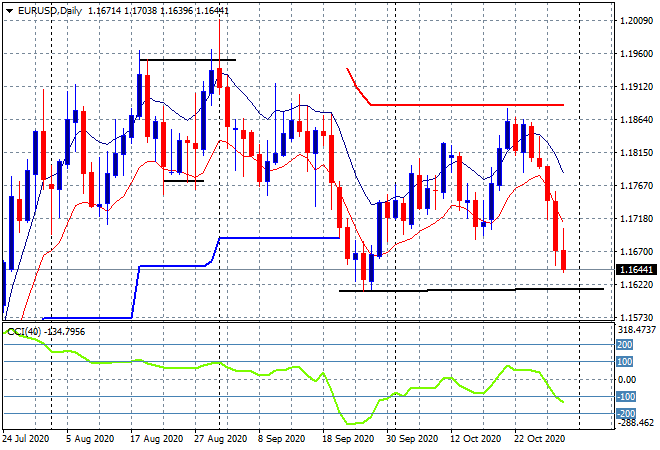
Currency markets continue to broadcast a defensive mood with Euro remaining well below the 1.17 handle as it reaches a new monthly low. The daily chart shows the potential bottom a the mid September lows but there is potential for further lows in the wake of volatility and further shutdowns across the continent, skewing the nascent economic recovery and getting the printers at Brussels in a flutter again:
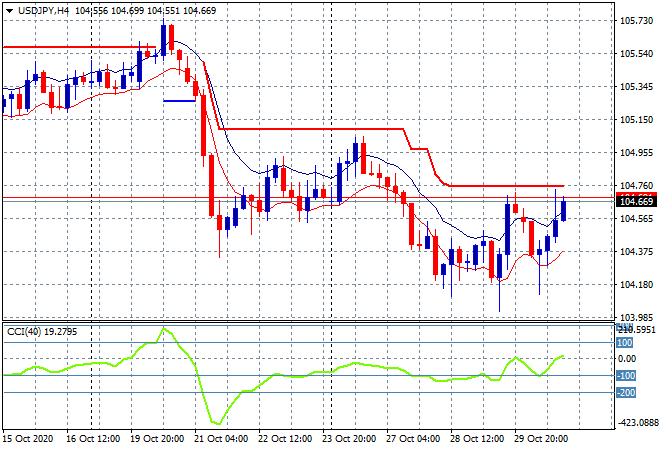
The USDJPY pair continues to firm here prior to the election with Yen safe haven buying abating somewhat in the wake of a stronger USD. Price wants to get back above trailing ATR resistance on the four hourly chart, matching its previous high around the 104.60 level. Momentum was oversold and now reverted to the average line, but price must get above ATR resistance at 104.70 or so to have any chance of arresting further falls:
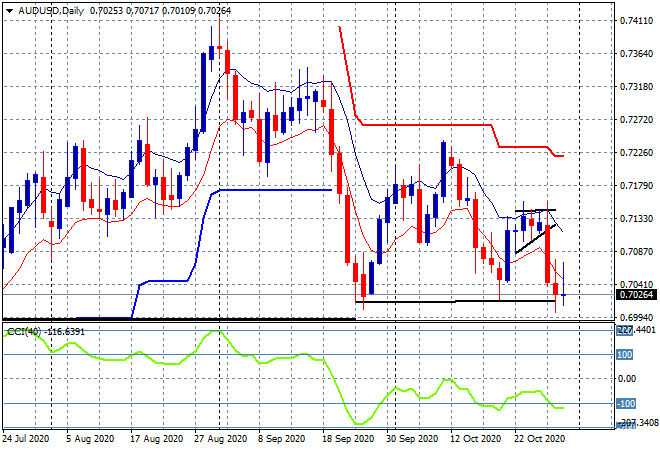
The Australian dollar remains under enormous pressure here as commodities continue to retrace with the daily chart showing a matching of the September lows (this seems to rhyme across markets) with a lot of selling pressure evident overhead. Weekly support slightly below the 70 handle must hold here or we could see a violent rout and a return to the 60’s:
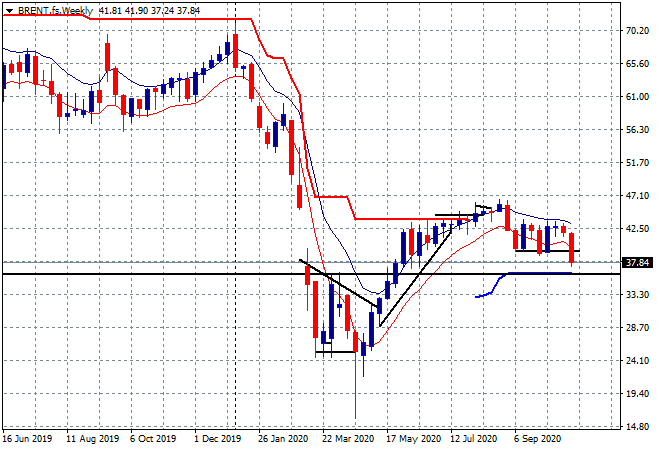
Oil volatility increased again to the downside with Brent falling below the $38USD per barrel level to finish the October trading month well below the September lows. The weekly chart is ver illustrative of the exhaustion of that reflation trade from earlier this year, having peaked at the mid $40’s now rolling over as Europe goes into lockdown and the US going to hell:
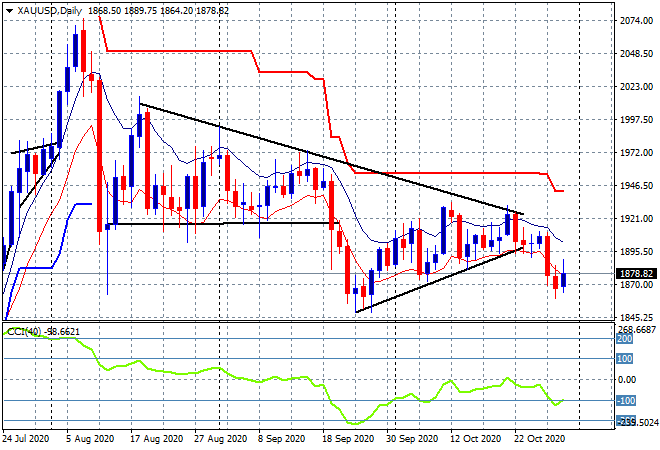
Gold like other undollar assets is still under a lot of pressure, having previously broadcast its intent of falling even further, finishing the week well below the $1900USD per ounce level. The daily chart is just holding on above the September lows at the $1845USD per ounce level and it would take a big reversal in USD fortune to see it touch the $1900’s again soon:
Glossary of Acronyms and Technical Analysis Terms:
ATR: Average True Range – measures the degree of price volatility averaged over a time period
ATR Support/Resistance: a ratcheting mechanism that follows price below/above a trend, that if breached shows above average volatility
CCI: Commodity Channel Index: a momentum reading that calculates current price away from the statistical mean or “typical” price to indicate overbought (far above the mean) or oversold (far below the mean)
Low/High Moving Average: rolling mean of prices in this case, the low and high for the day/hour which creates a band around the actual price movement
FOMC: Federal Open Market Committee, monthly meeting of Federal Reserve regarding monetary policy (setting interest rates)
DOE: US Department of Energy
Uncle Point: or stop loss point, a level at which you’ve clearly been wrong on your position, so cry uncle and get out!