Supports broke, so now what as the 2020 election looms
S&P 500 (SPX) broke below the tactical supports and Fibonacci levels highlighted in recent Market Comments. This places the focus on a huge support for the SPX at the September low near 3209. Moving into the 2020 Presidential election and beyond, holding above this low vs decisively breaking below it is the difference between a bullish consolidation and a much more sinister double top.
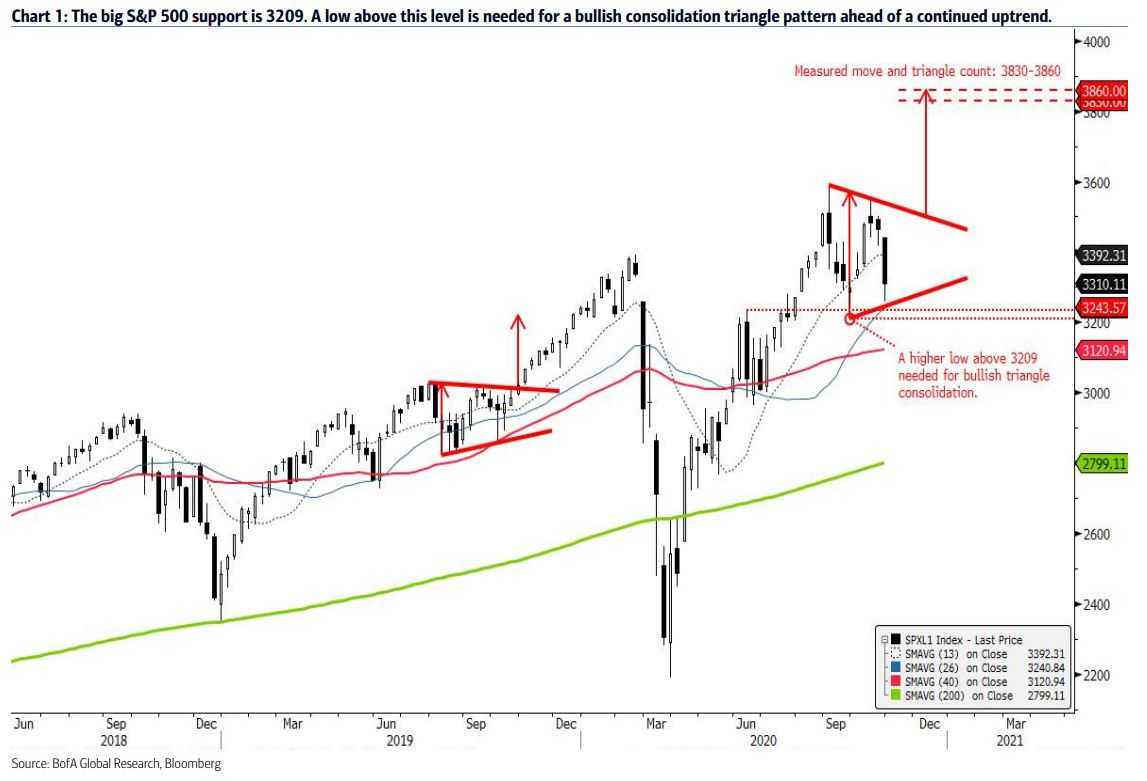
If SPX holds 3209, bullish triangle continuation pattern
Many of our tactical indicators entered October in bullish position. Examples include new highs for key advance-decline lines, a bullish breakout for the percentage of SPX stocks above 200-day MAs and a probe to new lows for the US high yield option adjusted spread. In our view, these signals are a potential leading indicator of new highs for the SPX and increases the potential for key 3209 support to hold. If the SPX holds above this big support, the potential builds for a bullish triangle that if completed on a decisive breakout above 3525-3550 would favor a continued uptrend to 3830-3860.
3-month VIX vs VIX is oversold heading into election
The good news is that similar to heading into the 2016 Presidential election, the 3- month VIX vs VIX is below 1.0 and tactically oversold heading into the 2020 Presidential election (Chart Blast: 27 Oct 20). If history rhymes, this suggests a post-election bounce for the SPX.
But, tactical signals are needed to favor the bulls
The key tactical levels that the SPX needs to reclaim to favor the bulls are the rising 100-day MA near 3307, the big downside gap from 10/28 at 3342-3389 and the 3400- 3430 range, which is a confluence of resistance at the 10/12 downtrend line, 50-day MA and prior support turn resistance. Moves above these tactical resistances would increase the potential for the bullish triangle scenario.
If SPX decisively breaks 3209, a more sinister double top
The best 3-month and 6-month periods of the year for the SPX begin in November (Market Comment: 11 Oct 20), but if the SPX cannot muster the strength to trade above the key tactical resistances highlighted above, this positive seasonality would prove elusive and increase the risk for a double top on a decisive break below 3209. The best case under this scenario is that the bullish trading cycle stays intact and the SPX holds support from the rising 26-week MA to the rising 40-week MA in the 3240 to 3120 range, which would suggest a shake-out below a key chart level (3209) within a bullish trend. However, the double top scenario would not rule out a decline to the pattern counts at 2870-2830 or just over a 50% retracement of the March-October 2020 rally.
S&P 500 (SPX) broke below the tactical supports and Fibonacci levels highlighted in recent Market Comments. This places the focus on a huge support for the SPX at the September low near 3209. Moving into the 2020 Presidential election and beyond, holding above this low vs decisively breaking below it is the difference between a bullish consolidation and a much more sinister double top.
If SPX holds 3209, bullish triangle continuation pattern
Many of our tactical indicators entered October in bullish position. Examples include new highs for key advance-decline lines, a bullish breakout for the percentage of SPX stocks above 200-day MAs and a probe to new lows for the US high yield option adjusted spread. In our view, these signals are a potential leading indicator of new highs for the SPX and increases the potential for key 3209 support to hold. If the SPX holds above this big support, the potential builds for a bullish triangle that if completed on a decisive breakout above 3525-3550 would favor a continued uptrend to 3830-3860.
David Llewellyn-Smith is Chief Strategist at the MB Fund and MB Super. David is the founding publisher and editor of MacroBusiness and was the founding publisher and global economy editor of The Diplomat, the Asia Pacific’s leading geo-politics and economics portal.
He is also a former gold trader and economic commentator at The Sydney Morning Herald, The Age, the ABC and Business Spectator. He is the co-author of The Great Crash of 2008 with Ross Garnaut and was the editor of the second Garnaut Climate Change Review.