
September has historically been the worst month for the stock market, and this year was no exception with global equities producing their first monthly negative return since bottoming in March. In Australia, rising concerns about the deteriorating trade relationship with China, Victoria’s continuing shutdowns and looming end-September step-downs in income support programs all took a toll on heavy-weight market sectors such as banks and resource stocks. Despite these ‘counter-trend’ moves in September, global bond yields and the USD remain in a medium-term downtrend, with global equities and gold prices in an uptrend.
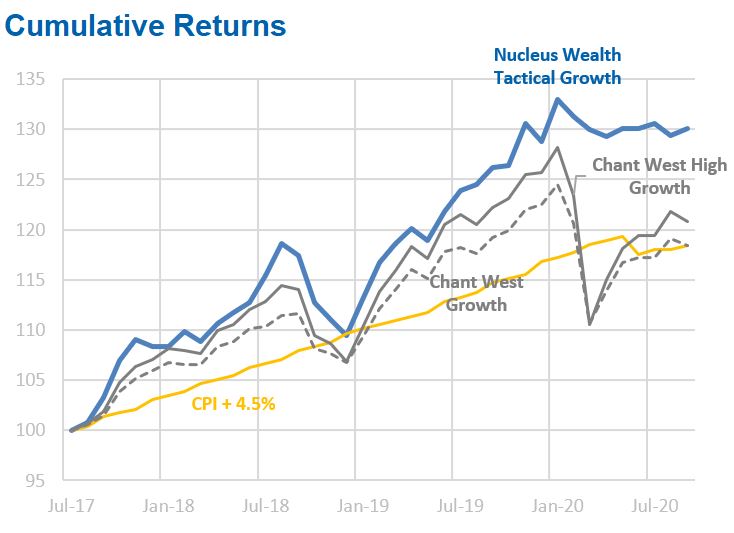
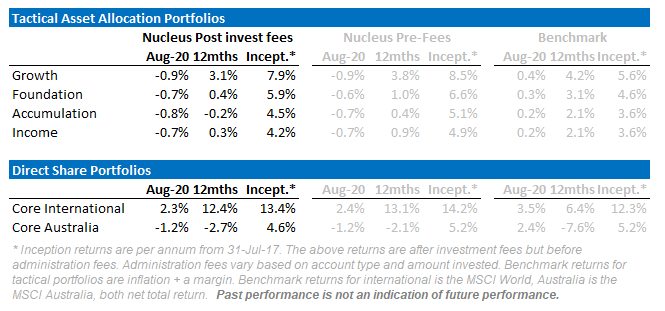
Our portfolios performed relatively well as our inclusion of defensive plays shielded the portfolios. This meant we booked modest gains while most competitors booked loses. Over the month we used lower prices to top up some of our bonds. We also lightened some defensives stocks that had run hard.
Q3 earnings = first decent read on profitability
I have a working theory that the September quarter earnings (Q3) coming out over the next few weeks are going to give excellent insight to the new normal.
Q1 earnings were mostly pre-COVID. Q2 was in the middle of the lockdowns and so not representative. Q3 is giving us our first clean(ish) look at what we can expect if current conditions continue.
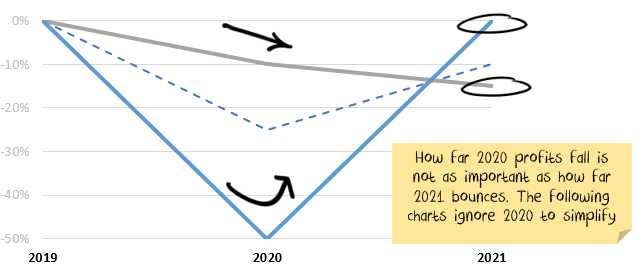
It isn’t how far profits fall, it is how far they get back up
COVID has created some huge falls in profitability as economies shut down. That doesn’t matter if the falls are temporary. Given the size of the percentage falls and rebounds, we find it more enlightening to ignore 2020 and look at the changes between 2019 and 2021.
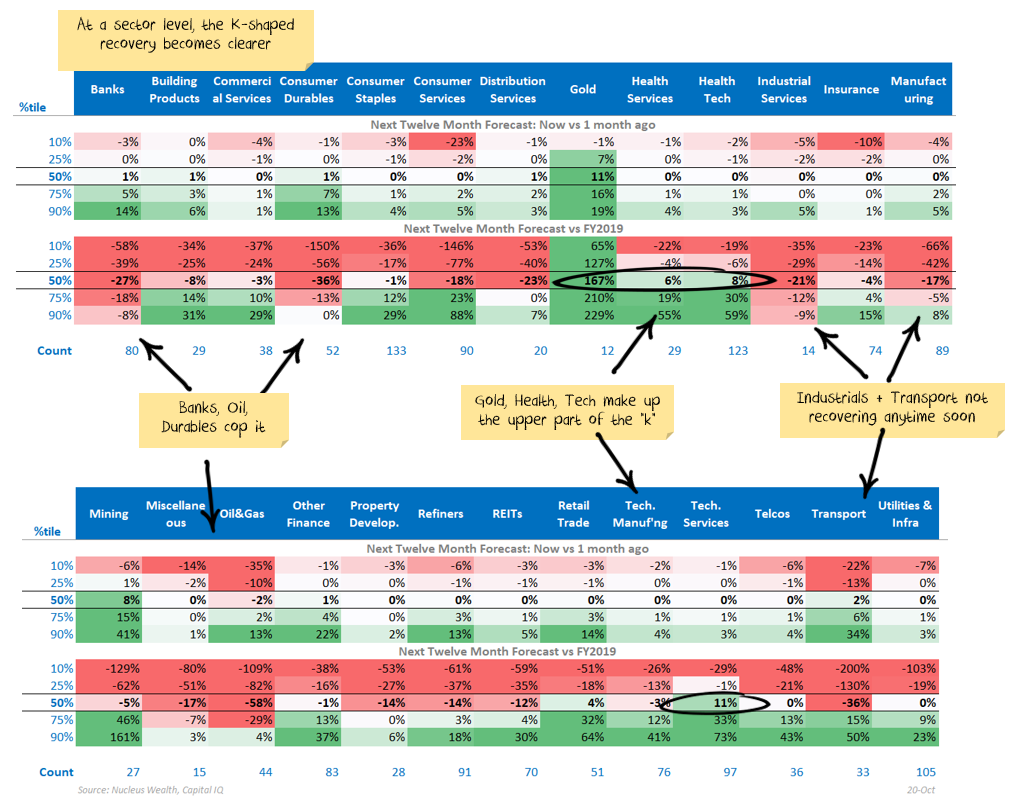
A “k” shaped recovery
The winning letter for the shape of the economic recovery seems to be “k”.
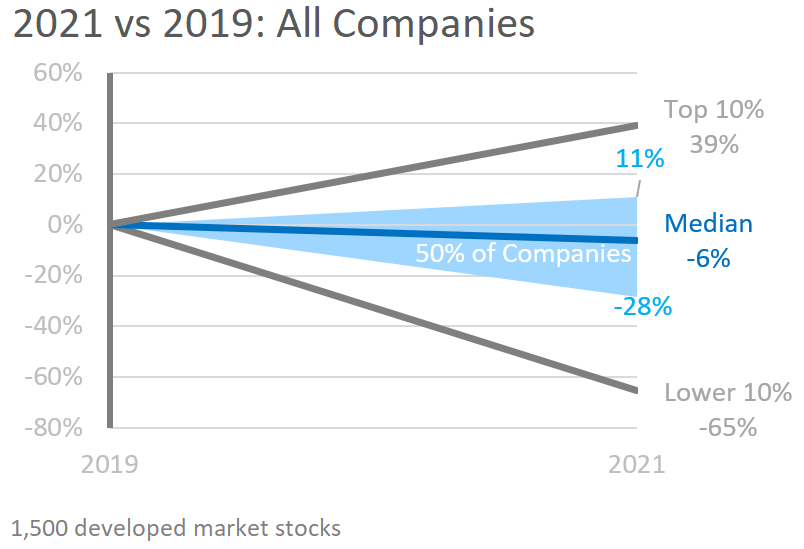
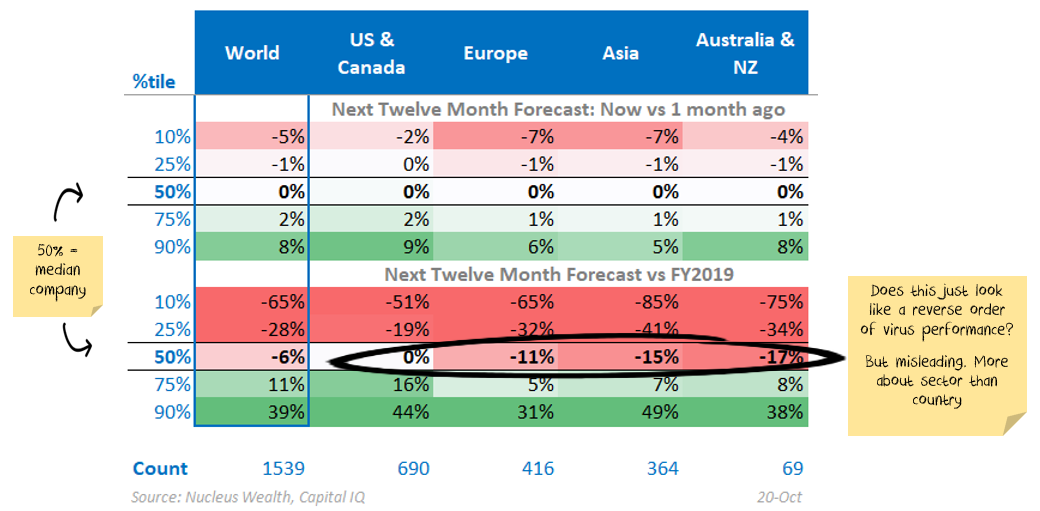
Half of the companies doing well and half doing badly. The stats support the theme:
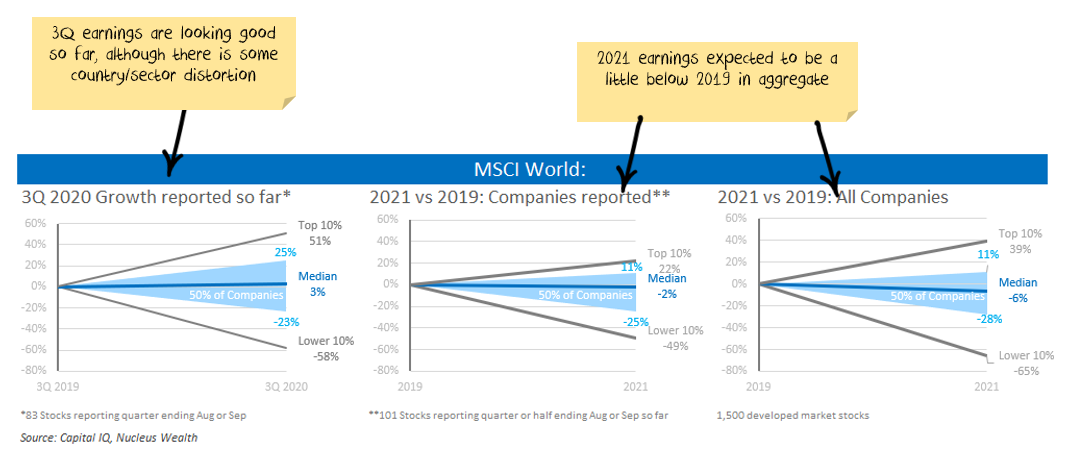
At a regional level some interesting stats show up:
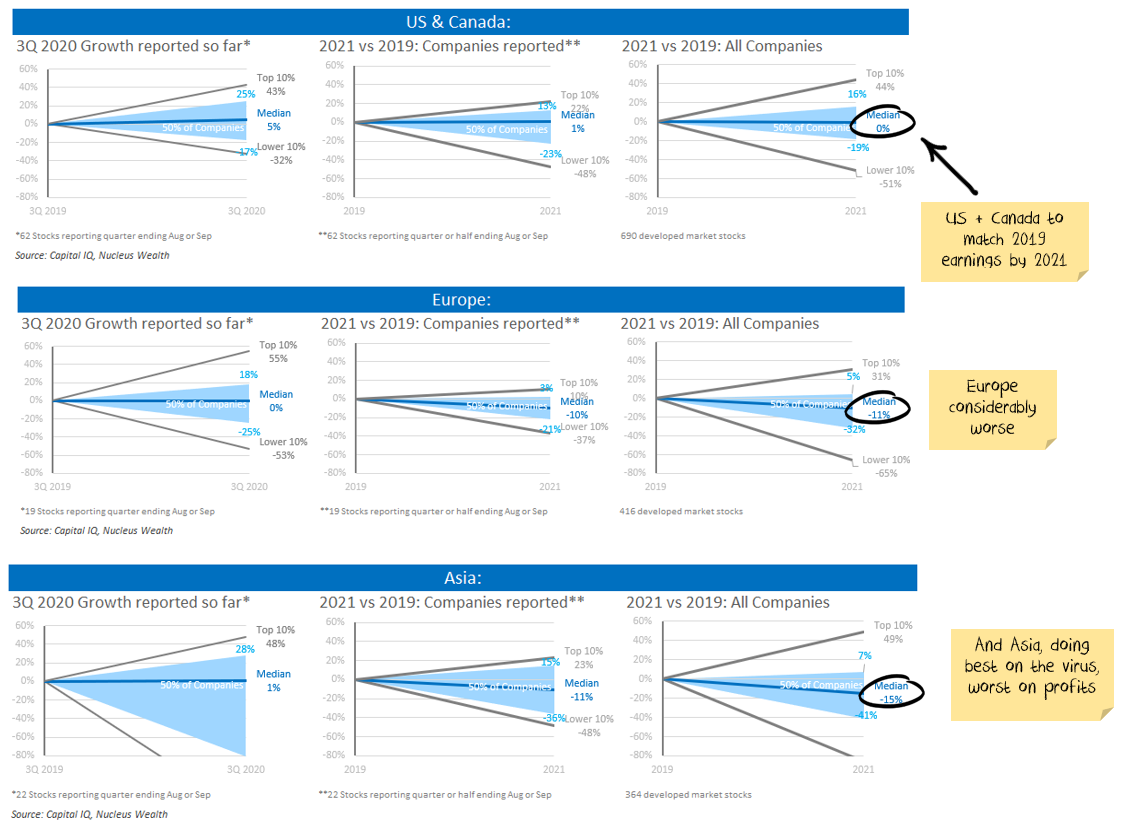
Inverse virus performance for profit rebound?
At an aggregate level, the performance by region actually seems to be the opposite of the virus performance. i.e. the more infected and the more dead, the sooner profits recover.
Industry performance is where the action is
Breaking the companies down by industry shows the error in the simplistic interpretation of the country data. The real difference between winners and losers is at the sector level.
The US has a much greater exposure to health and technology companies which are doing way better. The manufacturing and industrial companies which dominate some of the other regions populate the lower half of the k.
Finding value is still the problem
Companies where profits are looking the strongest also tend to be expensive. There are two main areas we are looking:
- Higher quality companies in the middle of the distribution with little downside. Some of these were left behind (from a value perspective) as markets swept higher and offer decent relative value.
- Stocks priced for an earnings disaster when the earnings are more likely to be “only” very bad. It is a more risky area of the market, but with many stocks priced for perfection, it is one of the few places left to find value.
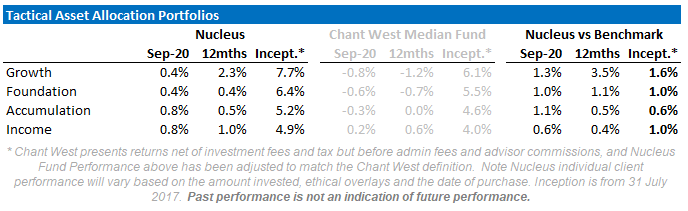
Performance Detail
The Tactical Growth Waterfall chart below breaks down this return showing the portfolio saw small gains in Equities, steady Income but some weakness in the Bond portfolio with the rise in Australian interest rates seen during the month.
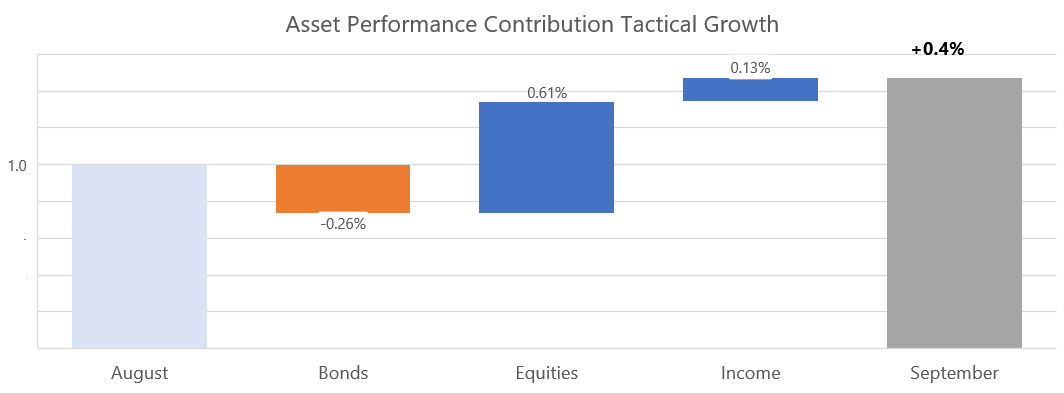
Over the month we took some profits from our Gold producers and Apple. We lightened our Euro currency exposure switching to USD. In the Bond portfolio following some profit-taking in August, we used the increase in rates during September to top up on five year Bonds where we see less risk.
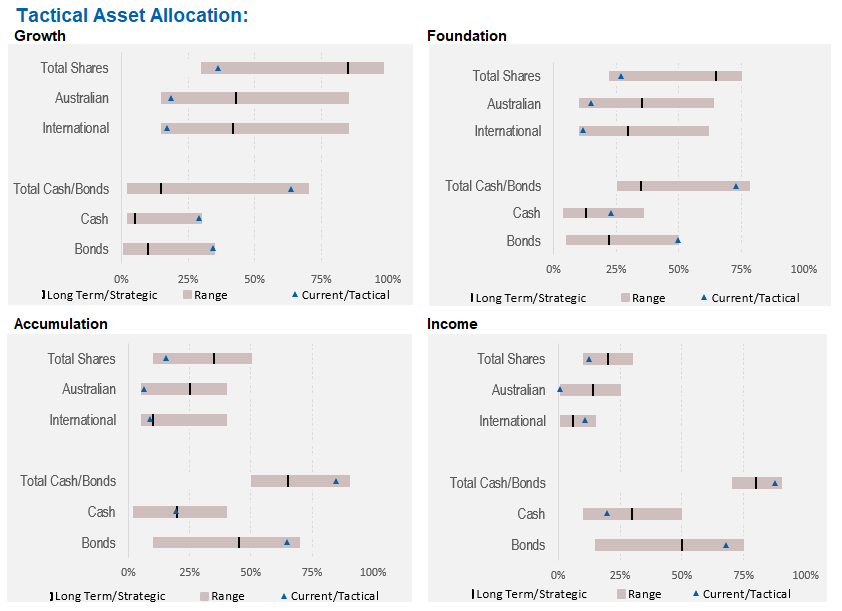
Asset Allocation
Our portfolios “went to ground” before the crisis hit, selling stocks and investing in bonds/cash/international currencies. All of our funds have a low weight to shares. This is a significant deviation and one that we have not undertaken lightly.
Note: This is a short performance report for our Australian and International portfolios which are always invested in shares. The longer asset allocation performance report will come out after the returns for comparable funds are available.
September saw global equities with their first monthly negative return since bottoming in March. This reflected a pullback in a soaring US technology sector and investors worried about stalled fiscal stimulus talks in Washington, the upcoming election, and new coronavirus cases in Europe. After a strong August, the Nasdaq made its all-time high on September 2nd before going into a tailspin. It was joined by all the global indices as a risk-off mood gripped the market. As September came to a close, the market cut its losses and rose strongly as US legislators appeared to reopen stimulus talks. However, all major global indices ended in the red apart from Japan, up 1% over the month.
Domestically the ASX 200 had a poor month with a 3.7% drop and the AUD fell almost 3% vs the USD.
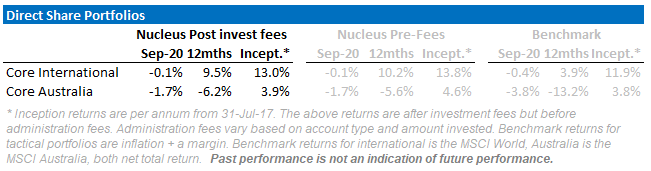
Our Core portfolios continue to outperform over September. At this point in the cycle, we have positioned our portfolios to a more defensive stance. The balance is in owning enough quality and growth stocks to share in the upside, without abandoning Value stocks to protect us from the downside. Currency proved a tailwind for Core International as the AUD weakened.
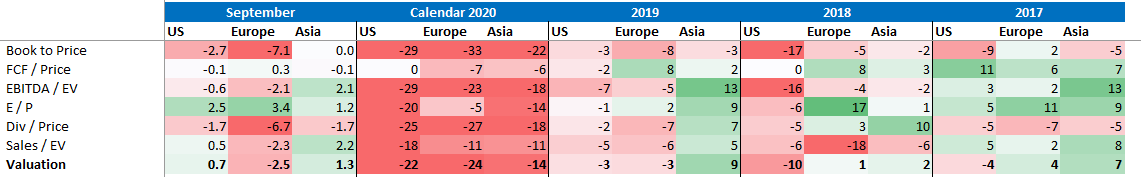
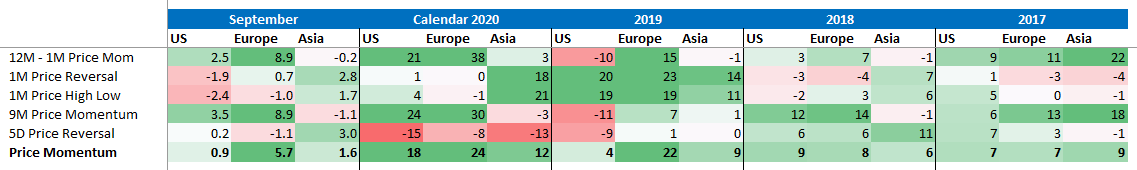
Naive Quantitative Factors
In the tables below, we look at naive quantitative factors. i.e. factors that buy stocks purely on quantitative metrics with no consideration of other factors. Sometimes you will see these factors called “smart beta”. We see these as an interesting window into what the market is paying for. But we caution investors against using them without understanding the fundamental and macroeconomic drivers.
Over 2020 so far, naive Value strategies (those that just buy the cheapest stocks on historical measures) have dramatically underperformed. That continued in September. We note better-targeted value metrics like cashflow have done much better than ones that rely on accounting measurement. Dividend yield continues to be a reverse indicator:
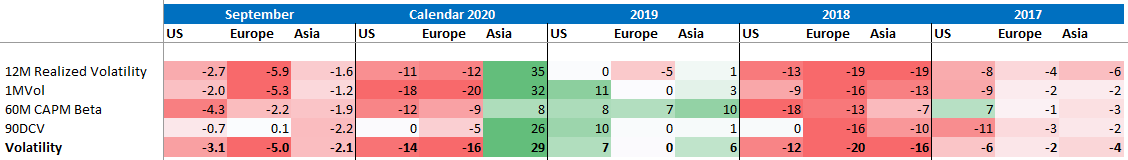
Not far behind value for poor performance in 2020, strategies that target low volatility had a bad September. In a falling market, low volatility should have helped.
Part of the story is sector selection, and previously stable sectors like REITs have been hit hard by COVID-19. In industries like Healthcare, low volatility stocks have beaten high volatility convincingly.
The other part of the story is (in my view) that the popularity of this strategy meant overpriced securities. i.e. valuations are still unwinding in this sector.
While we didn’t have a lot of exposure to this theme last year for valuation reasons, we have been increasing our exposure in recent months.
Source: Capital IQ, Nucleus Wealth
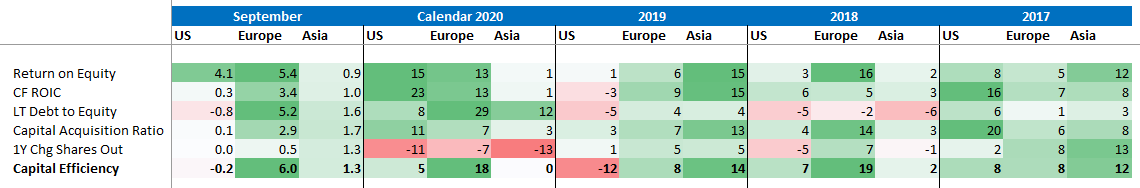
Naive Capital Efficiency strategies were OK in September, mostly adding to their generally good performance over 2020.
We contend that traditional Capital Efficiency ratios have been distorted over the last 20 years due to accounting changes. We target Capital Efficiency quite differently in our portfolios.
Source: Capital IQ
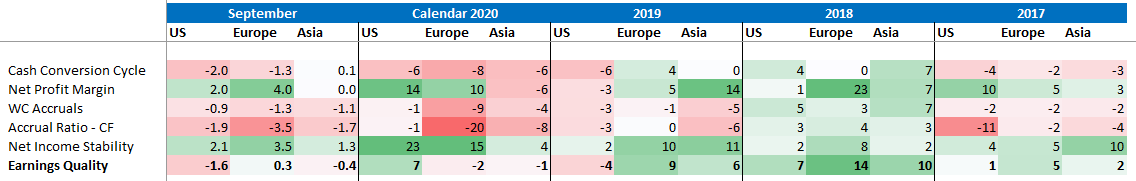
Naive Earnings Quality strategies have been random for the year, and that continued into September. High-profit margins and income stability have been good factors. With all of the shutdowns, supply chain issues and disruption, it isn’t surprising working capital measures aren’t given any help to investors. I expect this will be the case for some time yet.
Source: Capital IQ
Price Momentum basically keeps buying what is going up, selling what is going down. It has been a strong performer all year and had a good September.
We tend not to invest in this strategy as you need to trade a lot.
Source: Capital IQ
Core International
Each month we intend to present a selection of charts/tables that will visually show how the portfolio is performing.
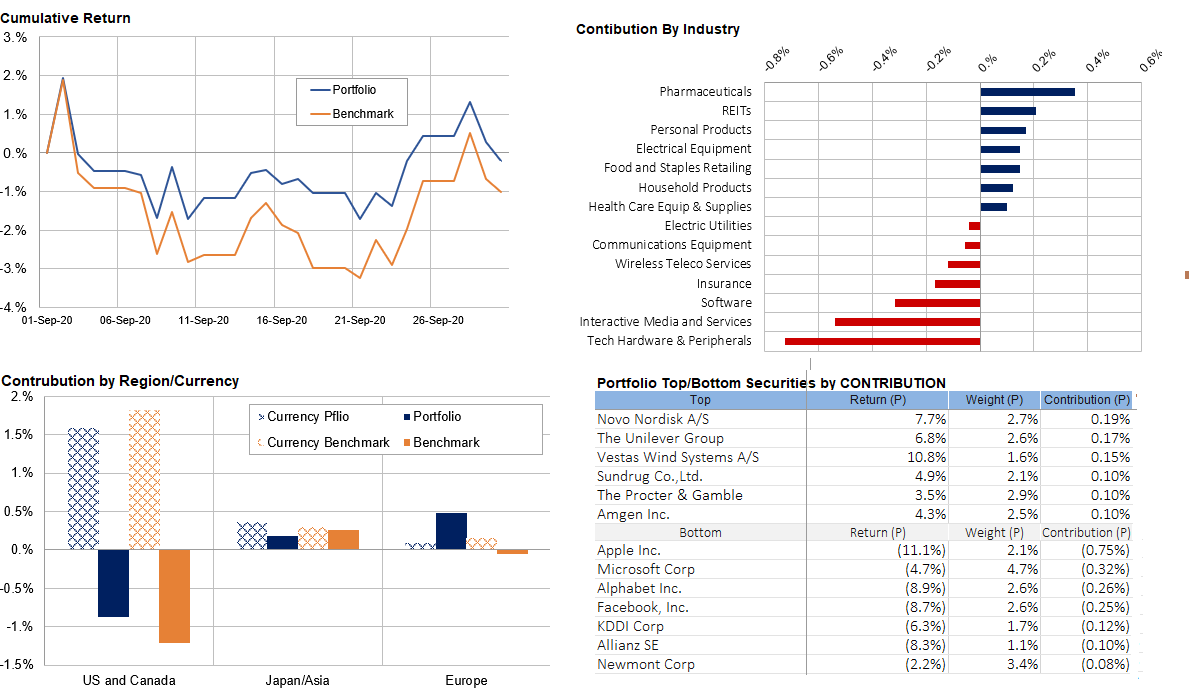
Our portfolio outperformed its benchmark over the month. Currency proved a tailwind as September, and the weaker AUD helped returns.
Regionally our European investments are doing very well. At the same time, our overweight in US Value stocks meant we didn’t suffer as severely from the US tech sell-off. The TopBottom table reflects this as our FAMGs (Facebook, Apple, Microsoft and Google) were top detractors while the Top10 is full of European Defensives.
During the month, we further de-risked the portfolio by down weighting Apple and Microsoft while up weighting defensives like Newmont (Gold producer), Johnson & Johnson, and Telenor (Emerging Market Telco).
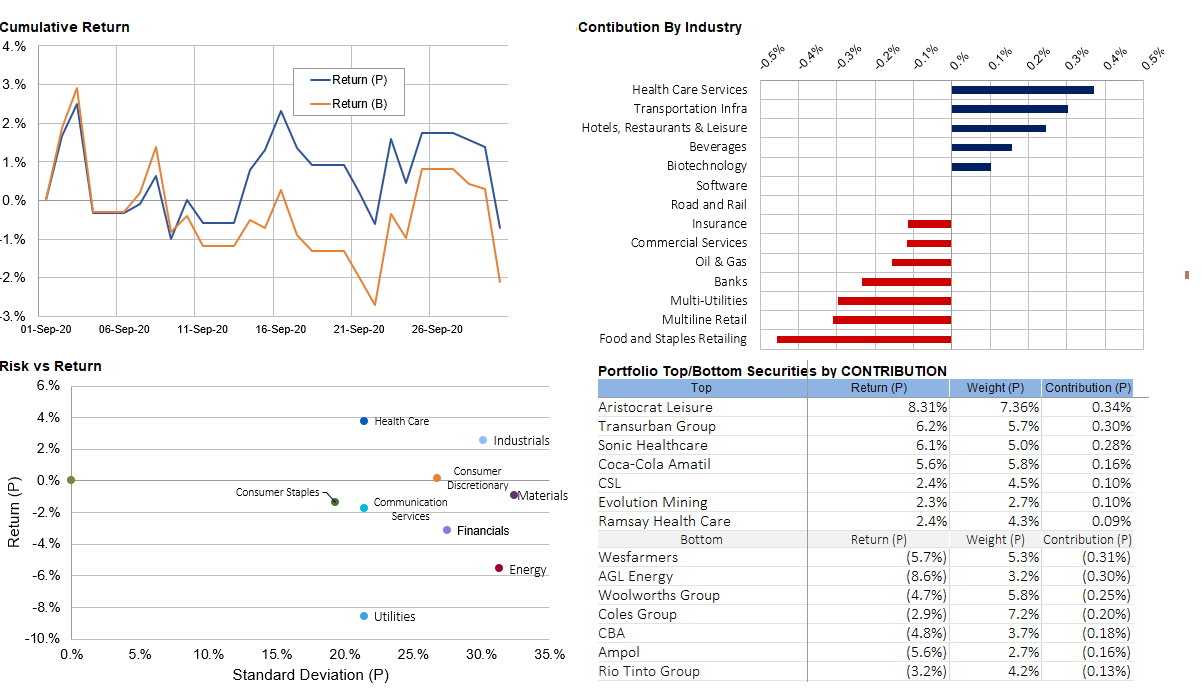
Core Australia
The Core Australian portfolio initially closely tracked the index over the month. But, as the correction gained momentum, our considerable overweight in gold producers protected the portfolio as did our underweight Energy position. Traditional defensives like Woolworths, Coles and Wesfarmers were underperformers as they failed to recover from the September correction. Toward the end of September, we down-weighted the gold producers and Telstra.
Key Catalysts
The US election is shaping up to be the key event over the next few months. The next wave of government stimulus is needed but held up by politics. If this turns into a protracted standoff then there are risks to the US stock market. Our expectation is an election where both parties claim victory will be treated particularly negatively by the stock market. This remains a material risk.
Polls suggest Joe Biden is likely to win. If so, company earnings will be reduced by around 10% due to increases in corporate taxes. So, I guess it is lucky that the stock market no longer cares about earnings!
The second major economic shock to watch is the effect of bankruptcies, evictions, and the resumption of interest payments on loans. Most developed markets put these on hold for six months in March. Many countries then extended those provisions into next year. We are keenly watching countries where policies are ending to get a forward look at what to expect elsewhere. Our view is an early resolution to bankruptcies gives a better economic outcome than extending and pretending.
The third major factor remains COVID-19, which is resurgent across the Atlantic economies well before we advance into vaccines and treatments. A rising death rate will deliver a new round of economic damage, one-way or another.
Wrap up
We changed our quant models a few months ago to put less focus on the last 12 months or next year. The focus instead is on a mix of inflation-adjusted historical earnings and the earnings from the second year. The problem with this is:
- Historical earnings don’t capture growth companies very well.
- Analysts are not very good at forecasting the second year of earnings in the best of times. We are not in the best of times.
- Stock market valuations are extremely stretched, even if we use aggressively positive forecasts.
The key to navigating as we exit the eye of the storm will be to not lose track of the principles of good investment while changing models enough to reflect that times are not normal.
We have a shopping list of high-quality companies that we want to own for our investors at lower prices for the very long term. Which is easier said than done. We picked up a few in March, but the problem with these companies they also bounce back the fastest once panic subsides.
Given a toxic mix of low-interest rates, volatility and expensive markets, investors will need to be significantly more nimble than in the past.
————————————————-
Damien Klassen is Head of Investments at the Macrobusiness Fund, which is powered by Nucleus Wealth.
Follow @DamienKlassen on Twitter or Linked In
The information on this blog contains general information and does not take into account your personal objectives, financial situation or needs. Past performance is not an indication of future performance. Damien Klassen is an authorised representative of Nucleus Wealth Management, a Corporate Authorised Representative of Nucleus Advice Pty Ltd – AFSL 515796.