

Risk markets fought valiantly to get back into the green overnight after the previous slump, as very encouraging US economic data – specifically a record GDP print – helped stave off the sellbots. The ECB had its monthly meeting, stating everything as she goes, however the post press conference saw Lagarde dampen spirits as the summer economic bounce is quickly fading amid the French and German lockdowns. The USD remained in defensive mode with the DXY up nearly 0.8%, as Euro and Aussie bore the brunt, while gold fell again as oil prices flummoxed going through support levels that had held for months.
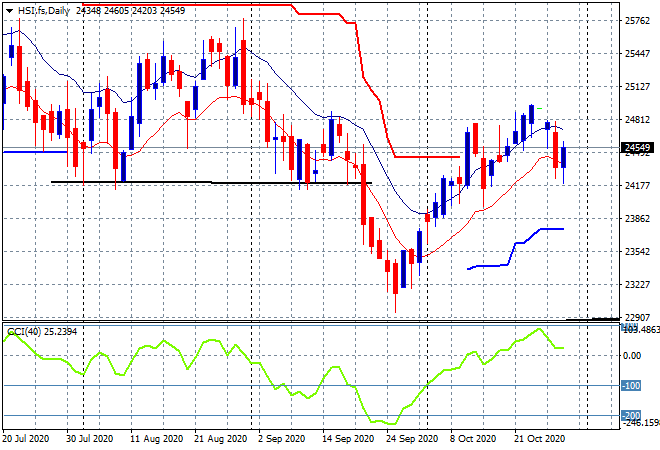
Looking at share markets in Asia from yesterday’s session where the Shanghai Composite advanced slightly, closing up 0.1% to 3276 points while in Hong Kong the Hang Seng Index continued its retracement, down 0.5% to 24583 points. The daily futures chart is suggesting some support is building at the 24000 point level as price wants to get back to the nascent uptrend – this will require a substantial close above the high moving average to work, although daily momentum remains positive:
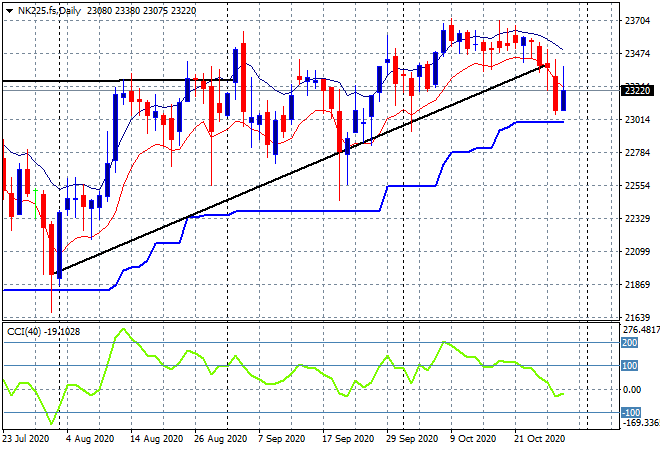
Japanese stock markets did okay considering the risk-off mood, with the Nikkei 225 closing only 0.3% lower at 23331 points. Price is firming at the daily ATR support at the 23000 point level which must hold here since the trendline is now broken with a lot of selling happening intrasession:
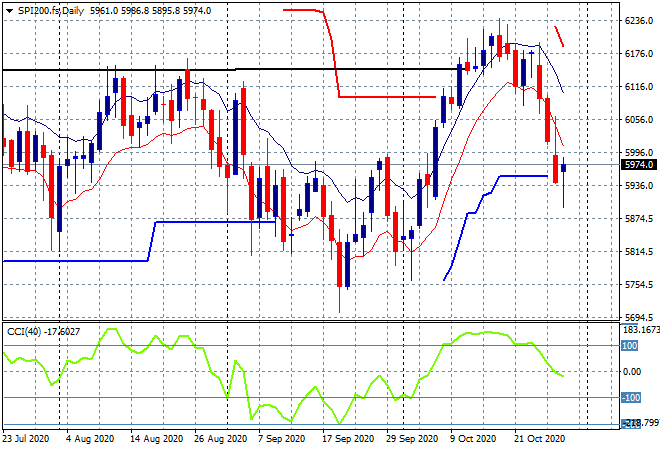
The ASX200 was hit the hardest, falling 1.6% after being down nearly 2% with gold and discretionary stocks hit the hardest, closing at 5960 points. The market is poised here with futures indicating a possible return to the green today with support at the 6000 point level possibly turning into staunch resistance going into next week’s US election:
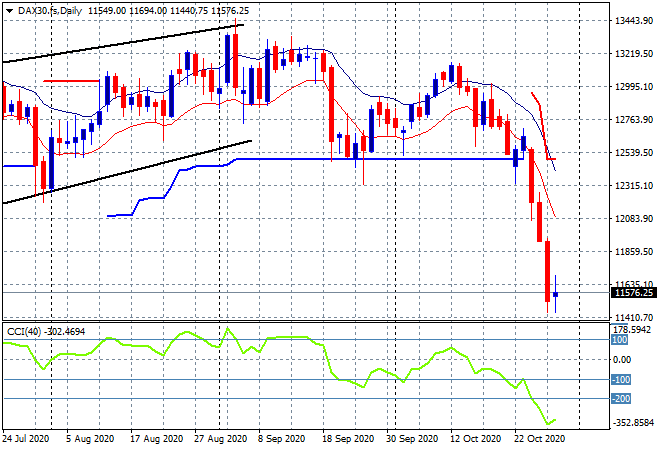
European markets are also sweating with a variety of scratch sessions and minor bounces across the continent following the recent selloff as the German DAX gained just over 0.3% to 11598 points in a very tepid session. The daily chart is looking very ominous to say the least, and I still contend its on the way to the 11000 point level if it doesn’t hold here at the 11500 point level:
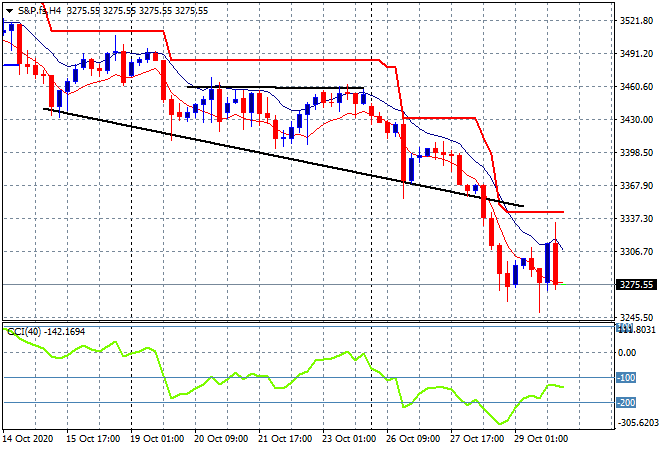
Wall Street reacted positively to the GDP and better than expected initial jobless claims with the S&P500 closing 1.2% higher to 3310 points, but then faltered in post close futures. The four hourly chart is still hsowing a market in clear decline as it gravitates towards the mid September lows at 3200 points. There is a chance of a breakout above the trailing ATR resistance level at 3340 points however:
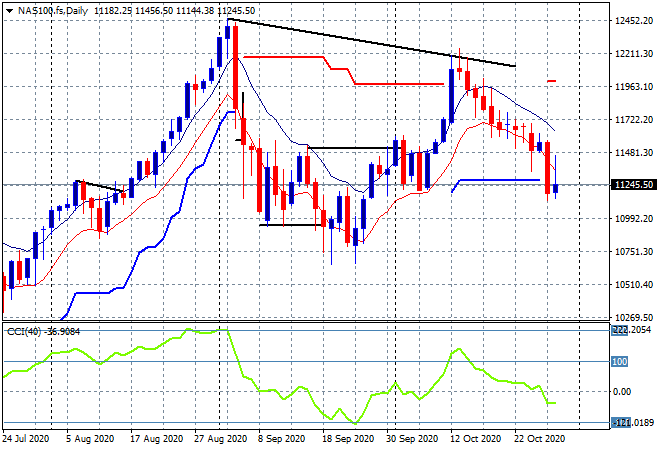
The NASDAQ gained 1.6% to close at 11185 points with the daily chart indicating a potential bottom here just above 11000 points, but its tenuous at best:
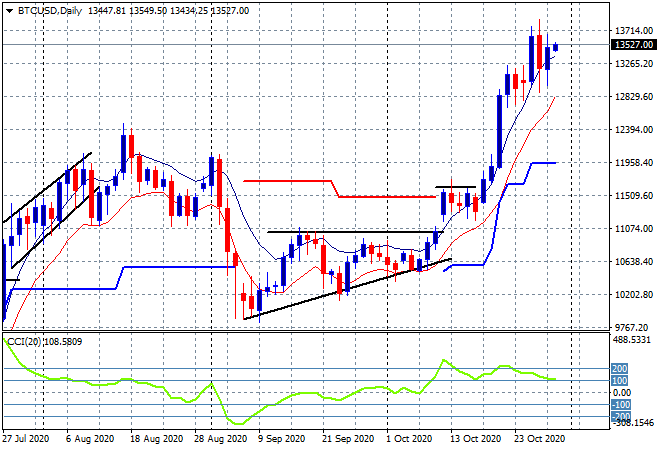
Bitcoin’s breakout is still in pause mode but unlike other undollars is not yet breaking down, still holding – indeed building again – well above the $13000 point level:
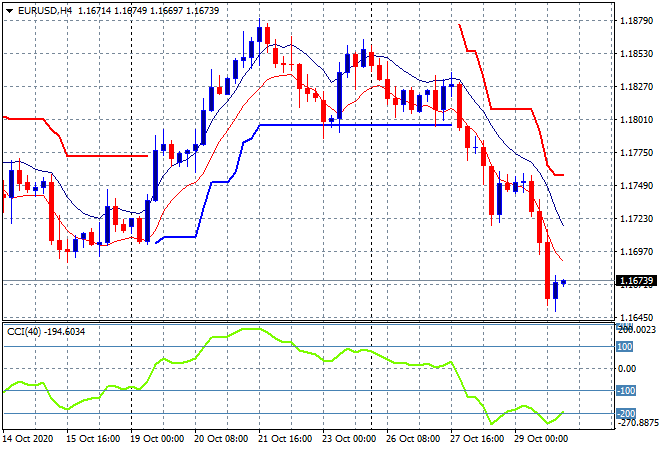
Currency markets continue to broadcast a defensive mood with the ECB meeting seeing the Euro pushed well below the 1.17 handle proper and through to a new monthly low. Momentum remains extremely oversold so there is potential for a short term swing trade here back towards, but probably not above the 1.17 level:
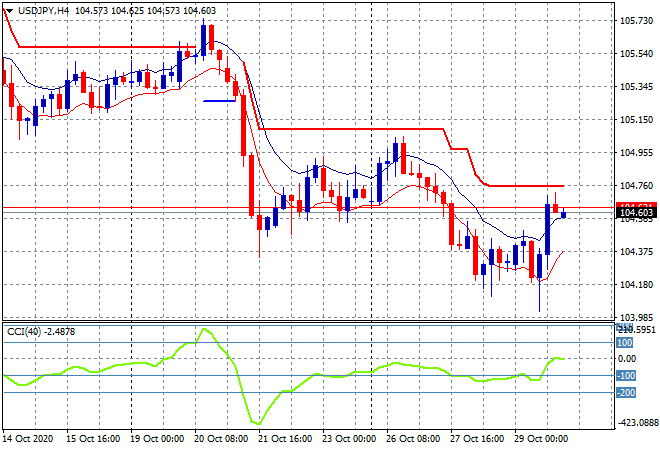
The USDJPY pair was firming here prior to last night’s economic releases which saw a small breakout up towards trailing ATR resistance on the four hourly chart, stopping at around the 104.60 level. Momentum was oversold and now reverted to the average line, but price must get above ATR resistance at 104.70 or so to have any chance of arresting further falls:
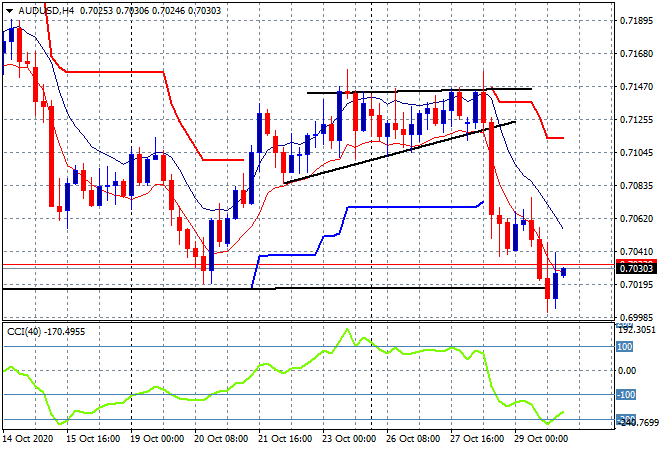
The Australian dollar remains under a lot of pressure here as commodities continue to retrace with a very brief look below the 70 handle last night before just getting back above to the 70.30 level this morning. The black horizontal line at the bottom of the four hourly chart equates to the Septembers lows and weekly support where there is some potential support to be found:
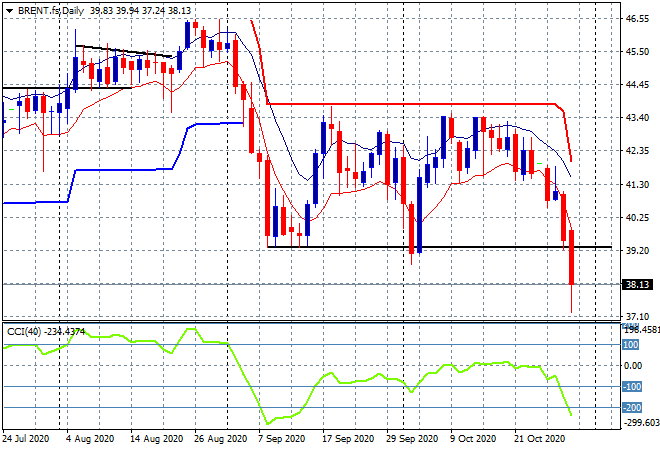
Oil volatility increased again to the downside with both markers off by more than 3% again with Brent falling straight to the $38USD per barrel level, now below the September lows (lower black horizontal line). There is a modicum of buying support here at the $37 level and we could see a violent short covering move back towards $39 or higher tonight:
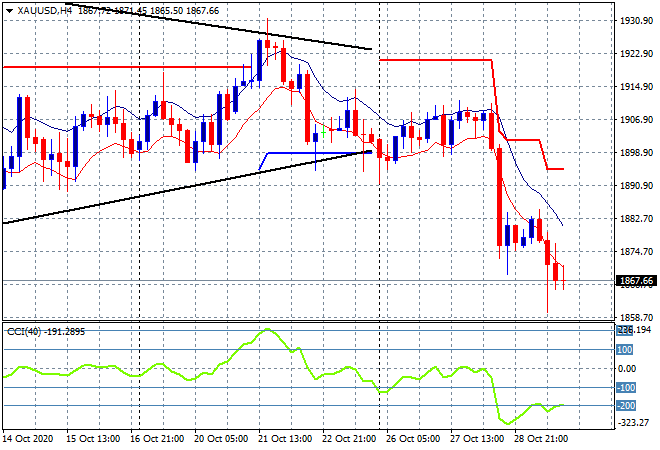
Gold just can’t hold on as it previously broadcast its intent of falling even further, remaining well below the $1900USD per ounce level overnight with another fall, this time almost touching the $1850 level. The daily chart is now pretty clear with a breakdown of the symmetrical triangle pattern signalling the next stop at the $1850 level or lower:
Glossary of Acronyms and Technical Analysis Terms:
ATR: Average True Range – measures the degree of price volatility averaged over a time period
ATR Support/Resistance: a ratcheting mechanism that follows price below/above a trend, that if breached shows above average volatility
CCI: Commodity Channel Index: a momentum reading that calculates current price away from the statistical mean or “typical” price to indicate overbought (far above the mean) or oversold (far below the mean)
Low/High Moving Average: rolling mean of prices in this case, the low and high for the day/hour which creates a band around the actual price movement
FOMC: Federal Open Market Committee, monthly meeting of Federal Reserve regarding monetary policy (setting interest rates)
DOE: US Department of Energy
Uncle Point: or stop loss point, a level at which you’ve clearly been wrong on your position, so cry uncle and get out!