

Its risk awfff as both Wall Street and European shares tumble in the wake of lockdowns on the continent and lunatics loose in the US election. Stocks fell over 3-4% on both sides of the Atlantic to new monthly lows with defensive assets like Yen rising, while gold and other commodities fell sharply. Asian shares are expected to open deep in the red in response
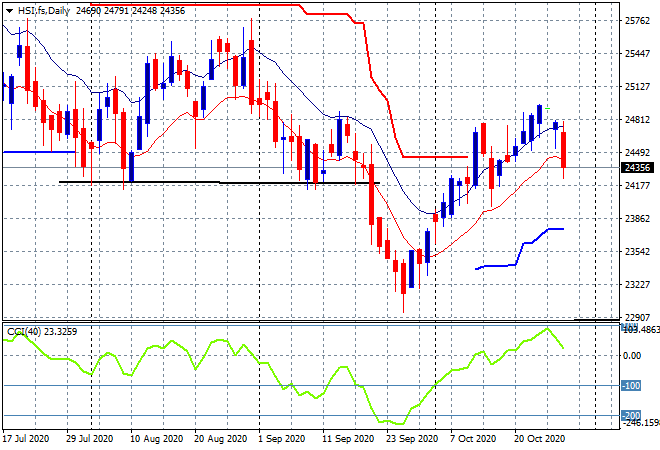
Looking at share markets in Asia from yesterday’s session where the Shanghai Composite finally put some runs on the board, closing 0.4% higher to 3269 points while in Hong Kong the Hang Seng Index is continued its retracement, down 0.3% to 24708 points. The daily futures chart is broadcasting further falls today on the open with the nascent uptrend seemingly finished here as price heads below the key low moving average line:
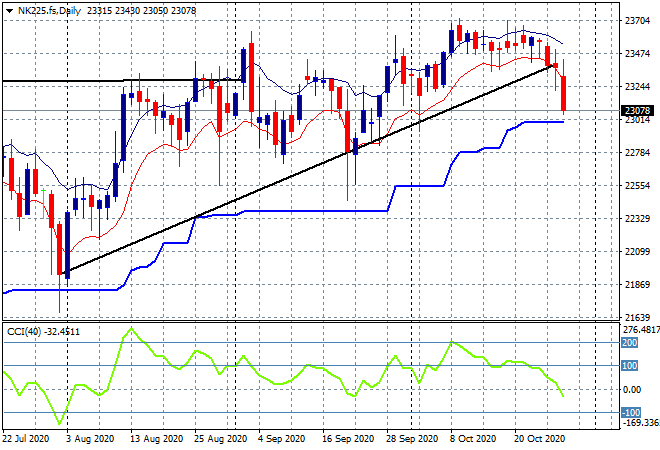
Japanese stock markets accelerated their own selloff, with the Nikkei 225 closing nearly 0.5% lower at 23374 points. Resistance at the 23500 point level was just unbeatable and so now we see a full rollover in effect. Daily ATR support at the 23000 point level must hold here since the trendline is now broken:
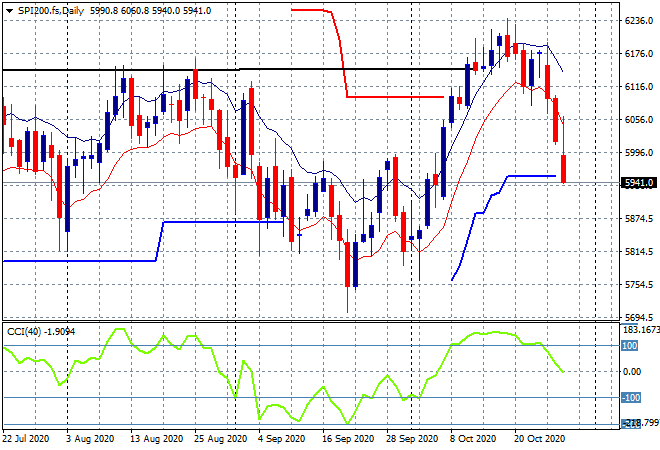
The ASX200 was able to finish slightly in the green yesterday following the CPI print, up only 0.1% to 6057 points but its quickly lost ground as futures are indicating a very large drop on the open this morning in line with Wall Street, as support at the 6000 point level is now pushed aside. A break below the key psychological 6000 point barrier will set off wider sell signals:
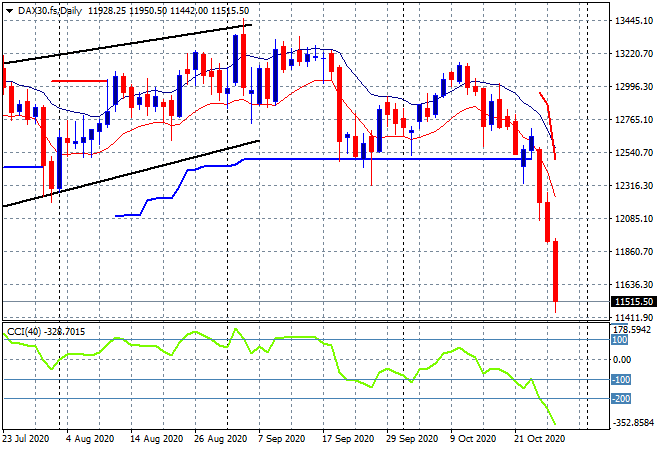
European markets have gone from selling to near panic with very broad losses across the continent as the German DAX lost nearly 4.2% to 11560 points making a new five month low. As I said yesterday, the previous break of support had set up a potential decline to the 11000 point level or further as the post-COVID gains are squandered and the country – and possibly most of the EU has to go into a second lockdown:
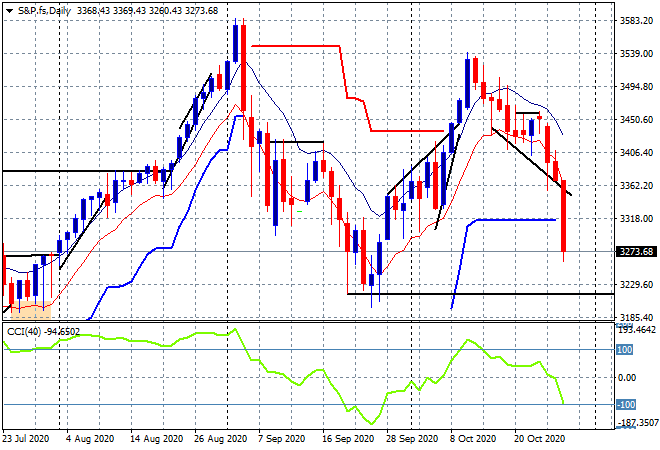
Wall Street is also catching up to the bad news, although the country continues to deny the COVID problem, its all about the stimulus and next week’s election. The S&P500 fell over 3.5% to 3270 points, with the daily chart showing a market in clear decline as it gravitates towards the mid September lows at 3200 points:
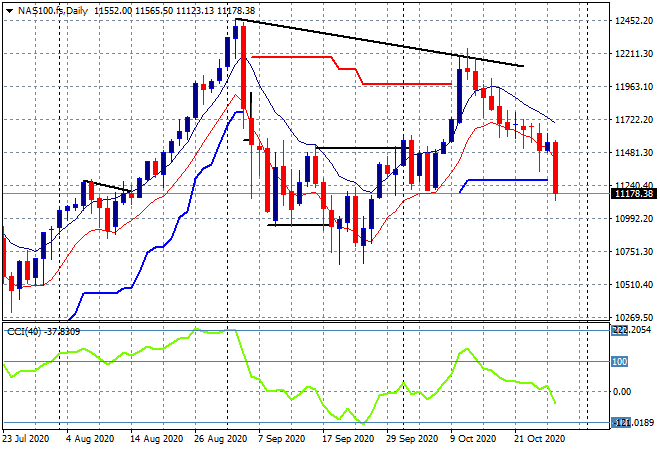
The NASDAQ fell almost 4% to just above 11000 points with the daily chart looking ominous here as it breaks decisively below previous resistance at the 11500 point level:
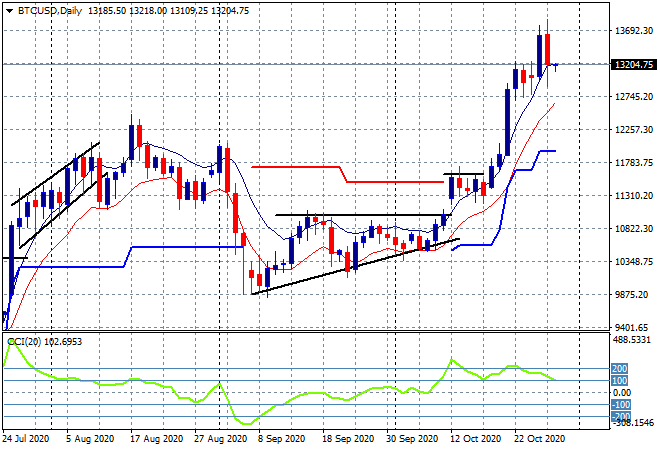
Bitcoin’s breakout is still in pause mode but unlike other undollars is not yet breaking down, still well above the $13000 point level:
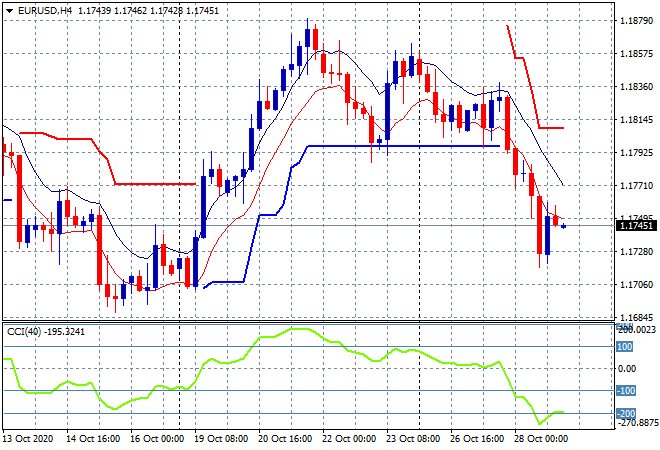
Currency markets continue to broadcast a defensive mood with USD pushing Euro well below the 1.18 handle proper and almost to a new two week low as it breaks below ATR support on the four hourly chart. There is potential for a short term swing trade here as momentum goes extremely oversold so watch for a return of price above the 1.1750 mid-level:
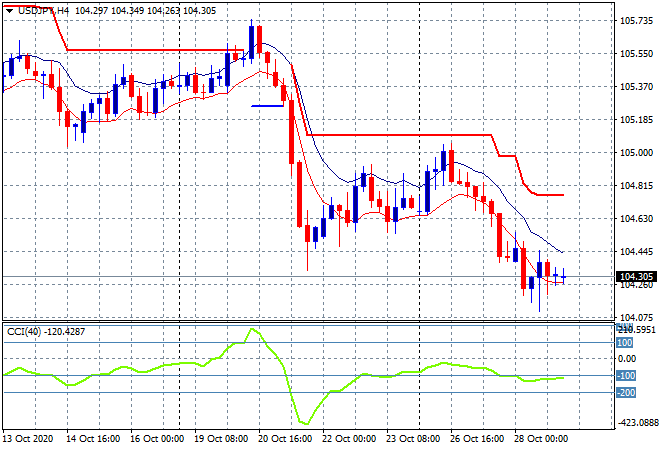
The USDJPY pair is firming here as Yen safe haven buying abated somewhat, with the pair finding a new bottom at a new monthly low at the 104.30 level. Momentum remains broadly oversold on the four hourly chart with the potential to fall back to the September lows at the 104 handle:
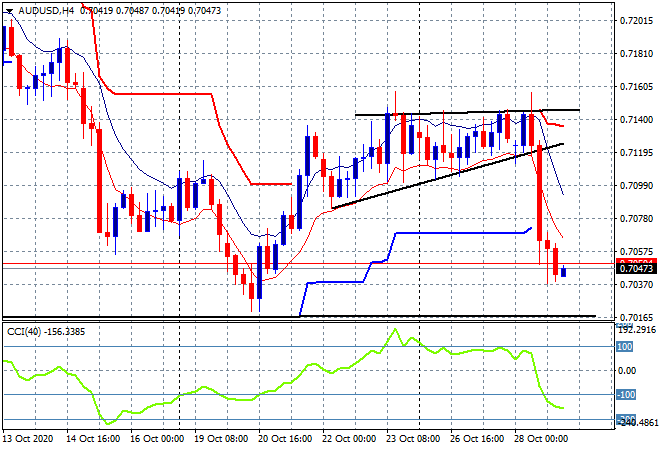
The Australian dollar had the biggest gut punch as commodities fell left, right and center, taking out all of the previous two week gains overnight to be back just above the 70.40 level this morning. The potential bottom is just above the 70 handle proper which equates to Septembers lows and weekly support:
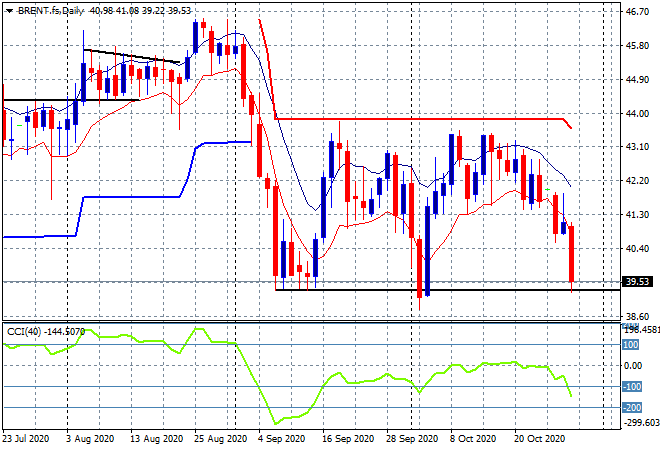
Oil volatility increased to the downside with both markers off by more than 5% in the wake of the lockdown news. Brent was hit hard, falling straight below the $40 level, now matching the September lows (lower black horizontal line) just above the $39USD per barrel level:
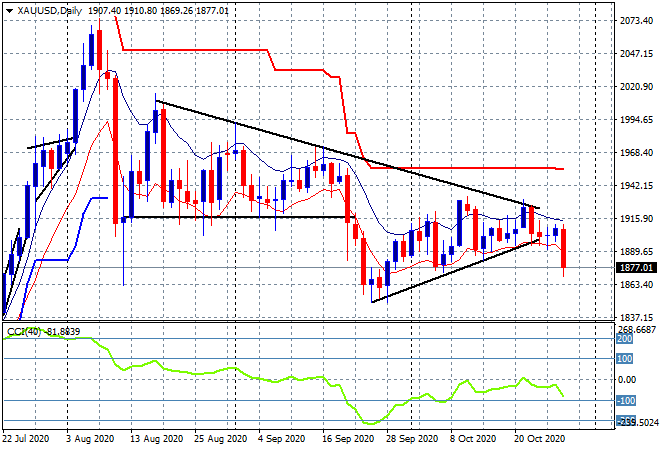
Gold was unable to hold on and has now broadcast its intent of falling even further, breaking well below the $1900USD per ounce level overnight in line with risk assets. The daily chart is now pretty clear with a breakdown of the symmetrical triangle pattern signalling the next stop at the $1850 level or lower:
Glossary of Acronyms and Technical Analysis Terms:
ATR: Average True Range – measures the degree of price volatility averaged over a time period
ATR Support/Resistance: a ratcheting mechanism that follows price below/above a trend, that if breached shows above average volatility
CCI: Commodity Channel Index: a momentum reading that calculates current price away from the statistical mean or “typical” price to indicate overbought (far above the mean) or oversold (far below the mean)
Low/High Moving Average: rolling mean of prices in this case, the low and high for the day/hour which creates a band around the actual price movement
FOMC: Federal Open Market Committee, monthly meeting of Federal Reserve regarding monetary policy (setting interest rates)
DOE: US Department of Energy
Uncle Point: or stop loss point, a level at which you’ve clearly been wrong on your position, so cry uncle and get out!