

A flurry of potentially good economic releases did not stave the risk off mood overnight as the chance of any stimulus this side of the US election closed out as the Senate was put out to pasture by the Republicans. A solid September durable goods orders and equally fixed consumer confidence print had little impact on markets with house prices surprising again to the upside in the ‘States. Today’s inflation data from the ABS may shake the Aussie dollar out of its stupor as the USD remains in defensive mode.
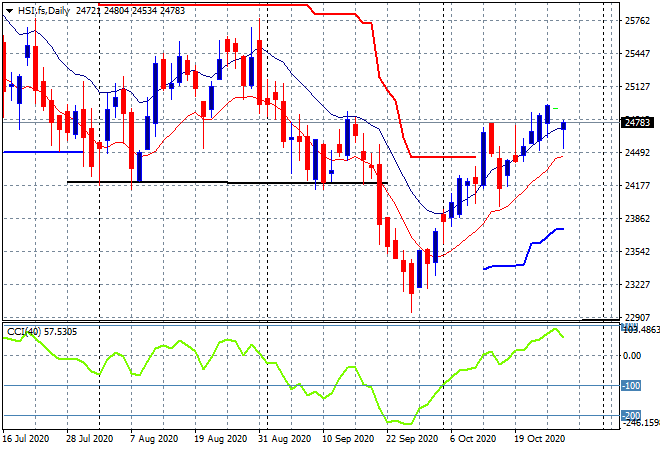
Looking at share markets in Asia from yesterday’s session where the Shanghai Composite put in a scratch session to finish up 0.1% at 3254 points while in Hong Kong the Hang Seng Index returned from its long weekend with a bad start, down nearly 0.6% to 24787 points. Despite this minor setback, the daily chart still shows the market in a growing uptrend with former support at the 24200 point level building again as momentum moves to the next phase and the upside target firms to 25500 or so:
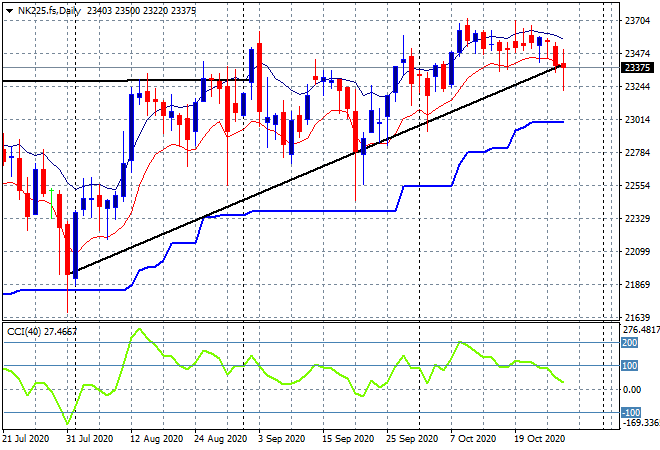
Japanese stock markets moved into selloff mode too, with the Nikkei 225 closing some 0.3% lower at 23452 point. Resistance continues to be extremely stubborn around the 23500 point level with no new highs in nearly two weeks as futures point to a possible break of the medium term trendline from the July lows. Watch the low moving average to possibly come under pressure below the 23400 level:
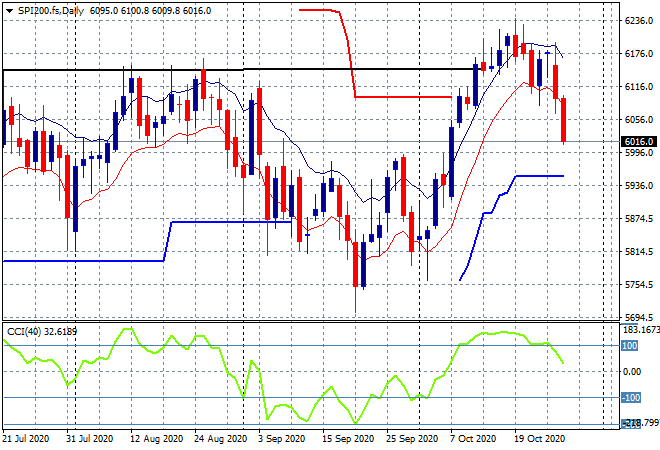
The ASX200 was the big loser, down 1.7% to 6051 points despite the lack of COVID cases. Futures are indicating another 0.5% or so drop on the open this morning in line with Wall Street, as support at the 6100 point level evaporates. Daily momentum has rolled over here from its overbought stage, so watch for a break below the key psychological 6000 point barrier to set off the sell signals:
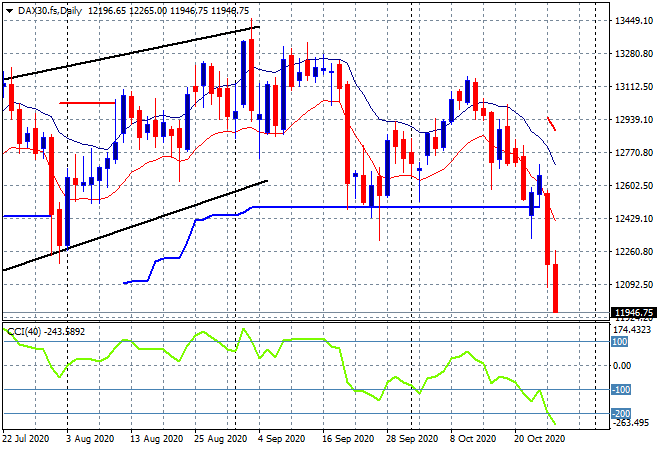
European markets continued their selloff with the German DAX down nearly 1% to 12063 points with further falls in post close futures. This takes price to the June lows and sets up a potential decline to the 11000 point level or further as the post-COVID gains are squandered:
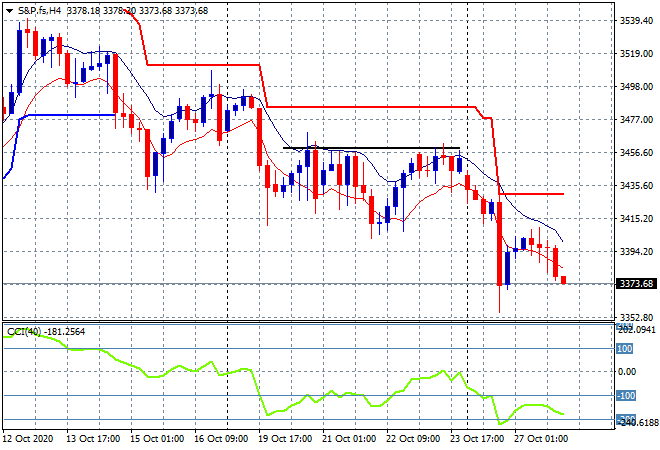
Wall Street is on the downtrend as well with only the NASDAQ putting on gains overnight. The S&P500 closed 0.3% lower to 3390 points, with the four hourly chart showing a market in clear decline as it continues below the 3400 point support level. The longer term picture is pointing to a further retracement down to the 3200 weekly/monthly support level:
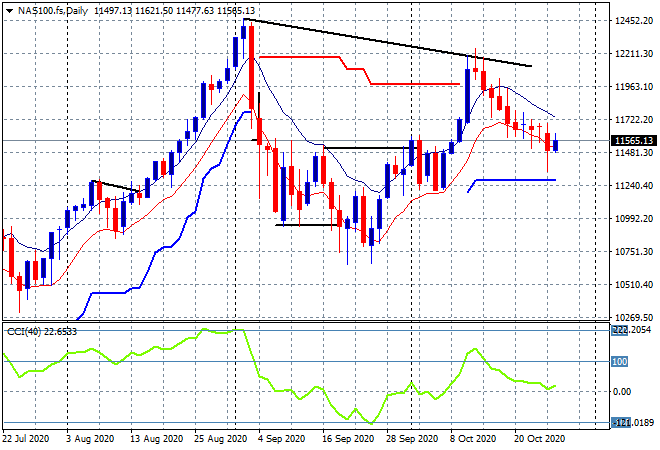
The NASDAQ was up 0.6% or so but the daily chart is still looking ominous here as it flirts with previous resistance at the 11500 point level:
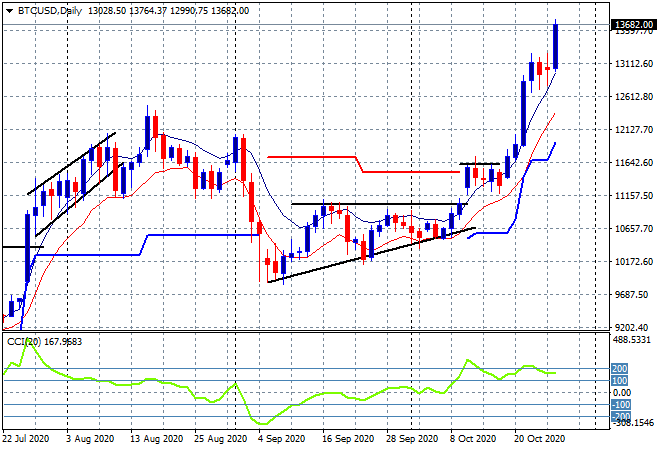
Bitcoin’s breakout is no longer in pause mode with another blowout well through and above the $13000 level after recently clearing the August highs. Go!
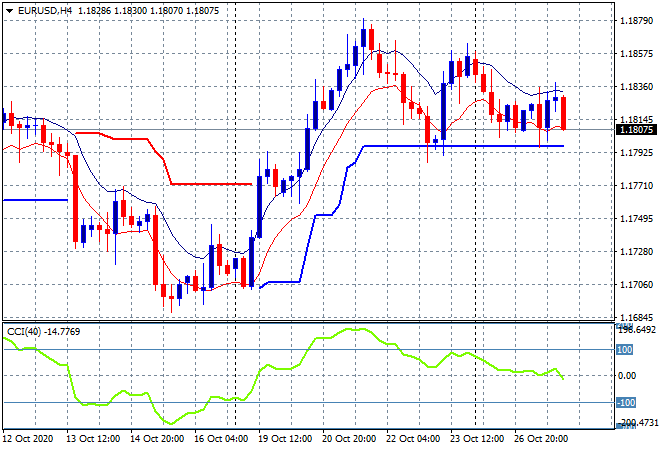
Currency markets suggest a continued defensive mood with USD pushing Euro down again back to the 1.18 handle proper late this morning after the consumer confidence print, with the potential to break below ATR support on the four hourly chart:
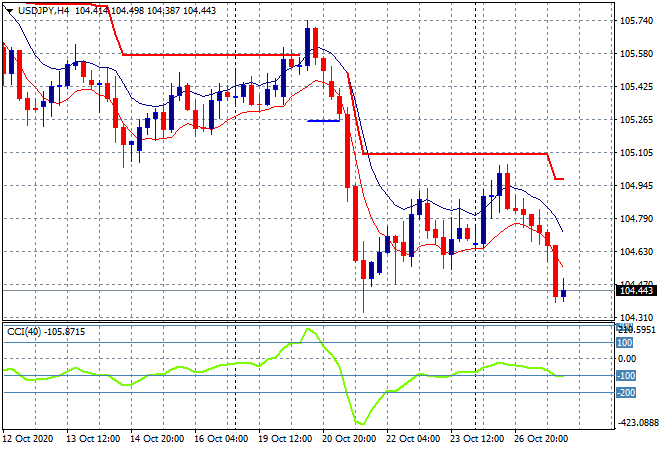
The USDJPY pair was soldoff the most as Yen safe haven buying accelerated, with the pair falling to a new monthly low at the 104.40 level. Momentum has gone from negative to broadly oversold on the four hourly chart with the potential to fall back to the September lows at the 104 handle:
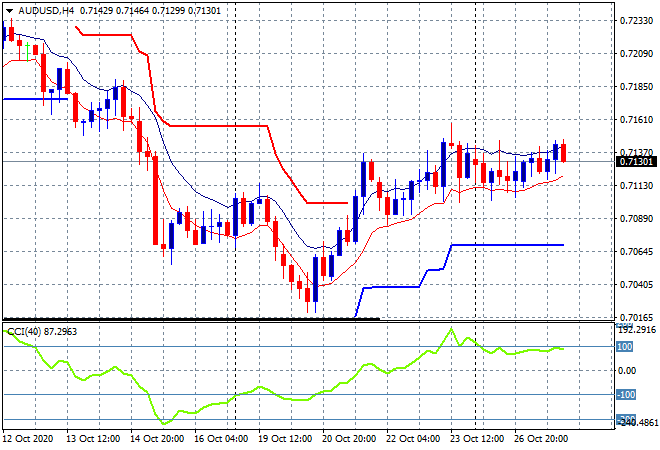
The Australian dollar was trying to breakout overnight, heading higher on the durable goods order but like other non-USD assets, fell back later in the session and remains stuck more or less at the 71.20 level. Momentum is still positive however, but going into today’s inflation print we could see a breakdown if it undershoots. Again, continue to watch the moving average band for signs of a breakout/breakdown:
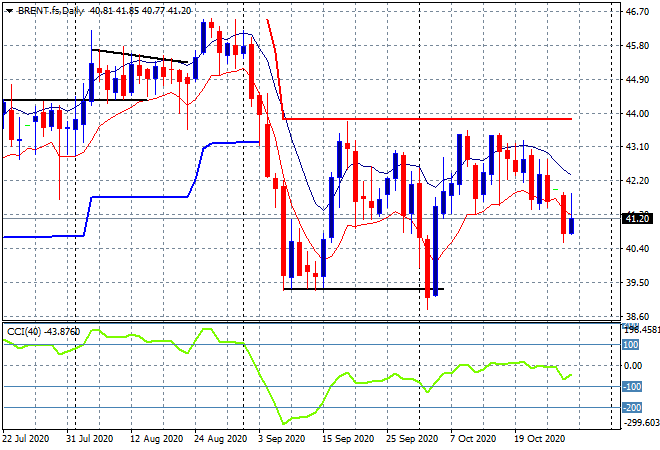
Oil volatility pulled back slightly with not much relative movement on both markers overnight, as Brent futures pushed back slightly above the $41USD level, with a lot of intra-session selling keeping it in its place. I’m still watching for a follow through that could take it back to the September lows (lower black horizontal line) at the $39 level:
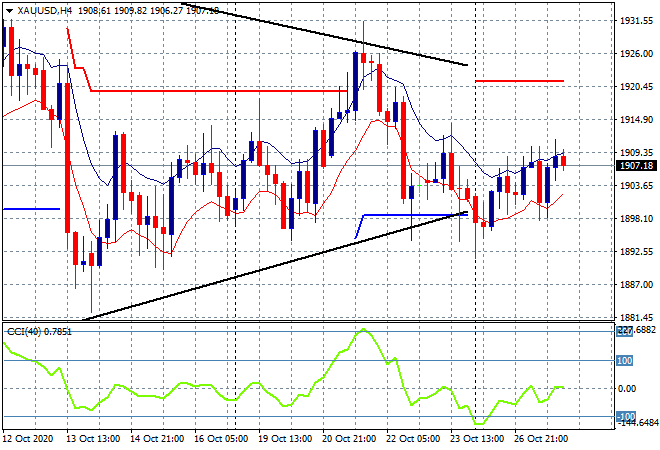
Gold is just holding on above the $1900USD per ounce level, with some wide session ranges as shown here on the four hourly chart. The daily and four hourly charts are continuing their symmetrical triangle pattern building as weakening buying support below is still weighed down by selling above at the $1920 zone:
Glossary of Acronyms and Technical Analysis Terms:
ATR: Average True Range – measures the degree of price volatility averaged over a time period
ATR Support/Resistance: a ratcheting mechanism that follows price below/above a trend, that if breached shows above average volatility
CCI: Commodity Channel Index: a momentum reading that calculates current price away from the statistical mean or “typical” price to indicate overbought (far above the mean) or oversold (far below the mean)
Low/High Moving Average: rolling mean of prices in this case, the low and high for the day/hour which creates a band around the actual price movement
FOMC: Federal Open Market Committee, monthly meeting of Federal Reserve regarding monetary policy (setting interest rates)
DOE: US Department of Energy
Uncle Point: or stop loss point, a level at which you’ve clearly been wrong on your position, so cry uncle and get out!