
Its risk off as Wall Street and European stocks took a tumble, started first by an underwhelming IFO survey in Germany followed by continued outbreaks and new record high cases of COVID-19 in the US and Europe alike. Stalemate over further fiscal stimulus in the US didn’t help confidence, with stocks falling over 2% although tech stocks held back the broader losses. The USD went into defensive mode while commodities fell, particularly oil as gold and silver remained relatively stable as US Treasury yields firmed.
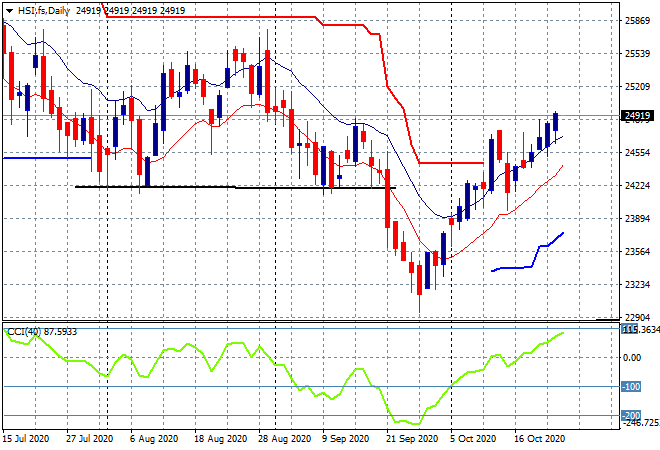
Looking at share markets in Asia from yesterday’s session where the Shanghai Composite lost ground quickly out the gate, eventually closing nearly 1% lower at 3251 points while in Hong Kong a holiday has the Hang Seng Index closed. The daily chart still shows the market in a growing uptrend with former support at the 24200 point level building again as momentum moves to the next phase and the upside target firms to 25500 or so:
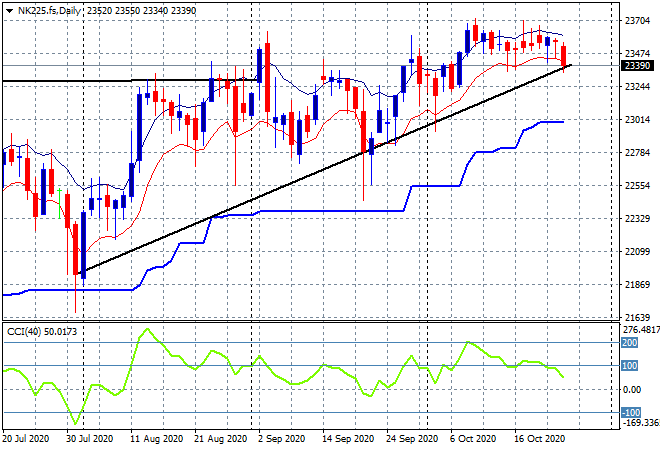
Japanese stock markets were in hesitation mode, with the Nikkei 225 closing some 0.1% lower at 23489 points. Resistance continues to be extremely stubborn around the 23500 point level with no new highs in nearly two weeks as futures point to a possible break of the medium term trendline from the July lows. Watch the low moving average to possibly come under pressure at the 23400 level:
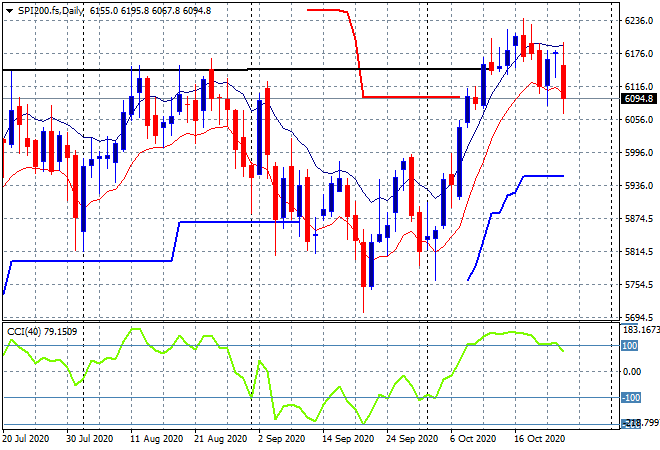
The ASX200 barely held on, despite a big takeover bid for Coca Cola Amatil, closing down 0.2% to 6155 points. Futures are indicating a near 1% drop on the open this morning in line with Wall Street, as support at the 6100 point level starts to evaporate. Daily momentum is rolling over here from its overbought stage, so watch for a proper close below the low moving average before enacting hedges:
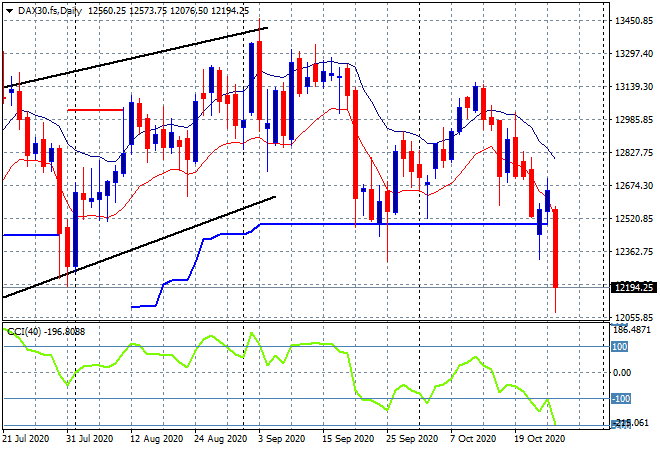
European markets flopped the worst as the spectre of a second wave in COVID raised its ugly head again, with most markets falling back 1-2%. The German DAX however fell the most as the closely watched IFO survey made traders leap to the sell button, falling nearly 4% to 12177 points. This takes price to a new four month low with the daily chart showing a clear breakdown after the previous rollover phase as daily ATR support at the 12500 point level is taken out:
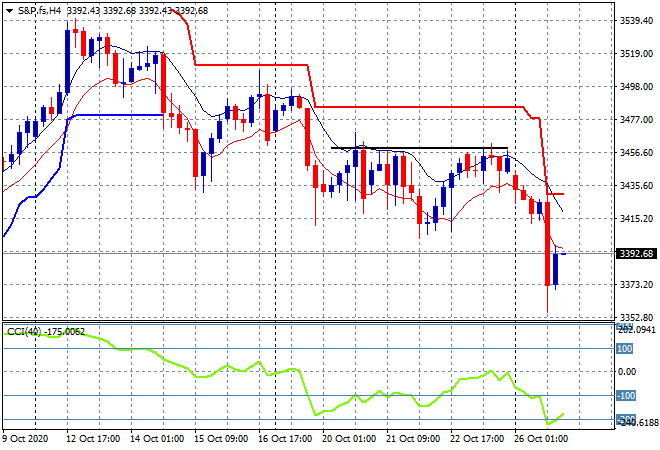
Wall Street is really struggling to find confidence here with a sympathetic breakdown not helped by any missives of stimulus from the White House. The S&P500 closed 1.9% lower to 3400 points as a result, with the four hourly chart showing a market in clear decline as it breaks through the 3400 point support level. I said yesterday that there was a potential bullish short term outlook on a break above the neckline at 3460 points but breaking through the previous lows at the 3415 level negate this completely:
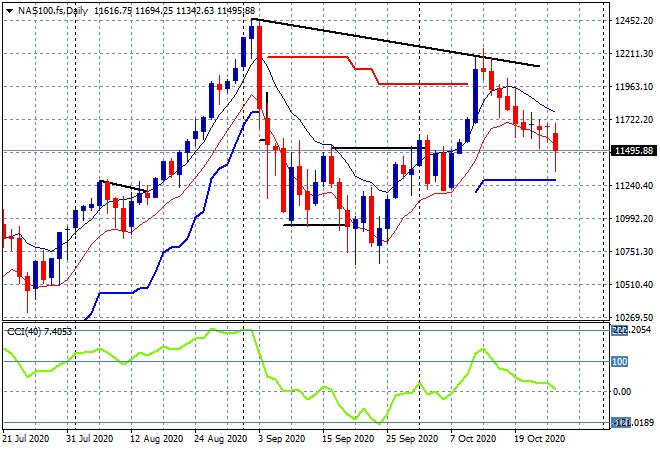
The NASDAQ was showing a better overall picture with the daily chart absorbing the 1.7% loss and taking it back to the pre breakout stage around the 11500 point level:
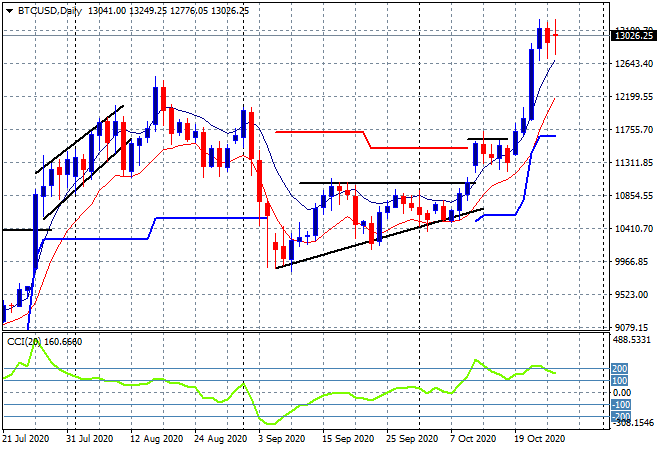
Bitcoin’s breakout continues to pause just above the $13000 level after clearing the August highs. As I said late last week, this is way overextended and would normally result in a retracement. but Bitcoin is not normal, technically watch the last three session lows for signs of any retracement:
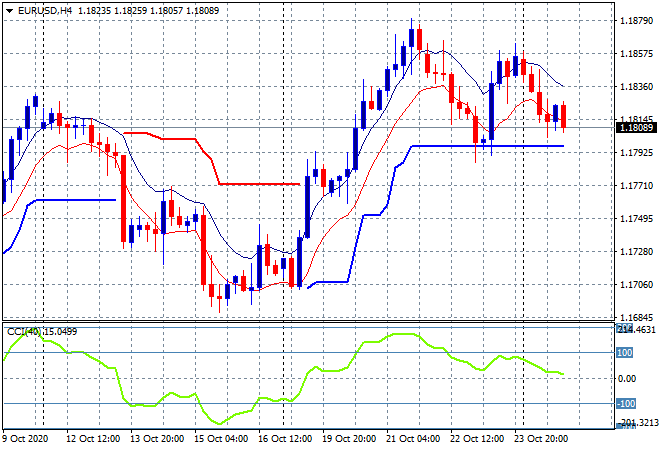
Volatility in currency markets came for the USD in a defensive mood with Euro retracing all of its Friday gains to be just above the 1.18 handle this morning, with the potential to break below ATR support on the four hourly chart:
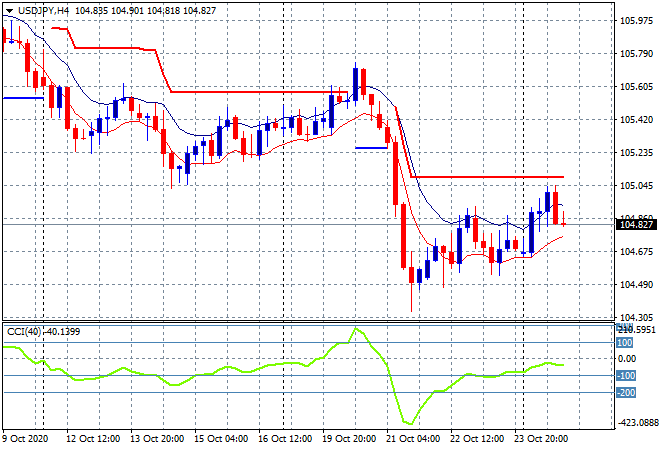
The USDJPY pair was unable to convert its small breakout towards the 105 handle because of the risk off mood, having fallen back to just above the Friday night highs. Momentum remains negative on the four hourly chart with the potential for a swing trade back up to trailing ATR resistance at the 105.10 level slipping here as Yen safe haven buying might be triggered soon:
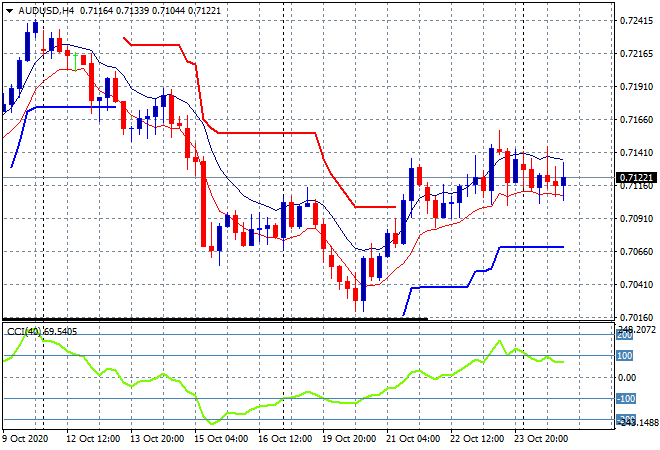
The Australian dollar was dead flat overnight, still stuck more or less at the 71.20 level where it finished last week. Momentum is slightly overbought and could potentially signal a break below the low moving average here as more commodity price falls are reflected. Effectively, watch the moving average band for signs of a breakout/breakdown:
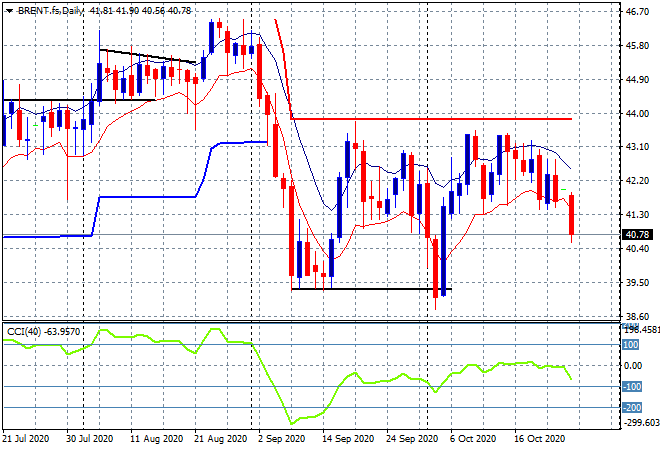
Oil volatility has finally broken in a direction, this time down, as Brent futures fell over 3% to be below the $41USD level, taking back nearly a month of gains and setup. Watch now for a follow through that could take it back to the September lows (lower black horizontal line) at the $39 level:
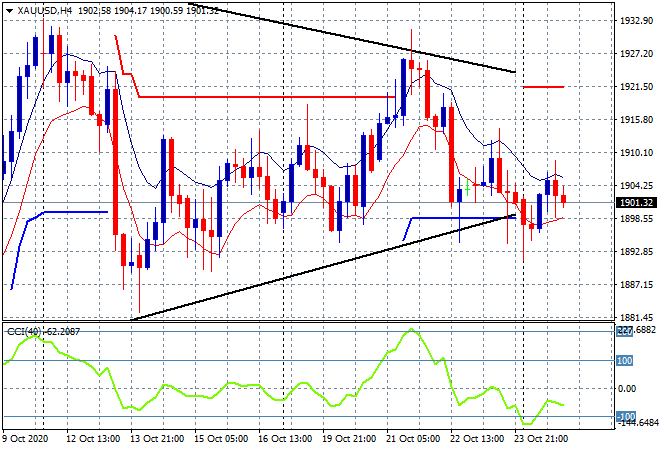
Gold is just holding on above the $1900USD per ounce level, but its tenuous at best. The daily and four hourly charts are continuing their symmetrical triangle pattern building as weakening buying support below is still weighed down by selling above at the $1920 zone:
Glossary of Acronyms and Technical Analysis Terms:
ATR: Average True Range – measures the degree of price volatility averaged over a time period
ATR Support/Resistance: a ratcheting mechanism that follows price below/above a trend, that if breached shows above average volatility
CCI: Commodity Channel Index: a momentum reading that calculates current price away from the statistical mean or “typical” price to indicate overbought (far above the mean) or oversold (far below the mean)
Low/High Moving Average: rolling mean of prices in this case, the low and high for the day/hour which creates a band around the actual price movement
FOMC: Federal Open Market Committee, monthly meeting of Federal Reserve regarding monetary policy (setting interest rates)
DOE: US Department of Energy
Uncle Point: or stop loss point, a level at which you’ve clearly been wrong on your position, so cry uncle and get out!