

Wall Street had a mild finish to the week with European stocks outperforming. The impasse on US stimulus talks this close to the election is holding up risk sentiment, with the USD retreating slightly and bond yields slightly lower. Commodity markets pulled back even further with oil slumping alongside copper and iron ore, while gold prices slipped back below the $1900USD per ounce level again.
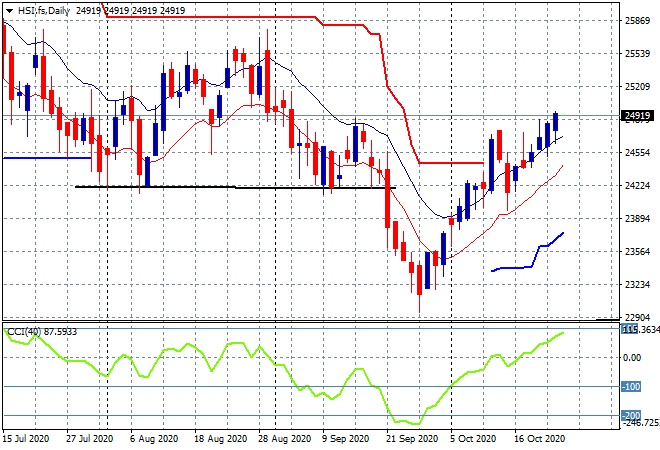
Looking at share markets in Asia from Friday’s session where the Shanghai Composite slumped at close, falling more than 1% to finish at 3278 points while in Hong Kong the Hang Seng Index went the other way and continued to firm, gaining nearly 0.6% to 24918. The daily chart shows the market in a growing uptrend with former support at the 24200 point level building again as momentum moves to the next phase and the upside target firms to 25500 or so:
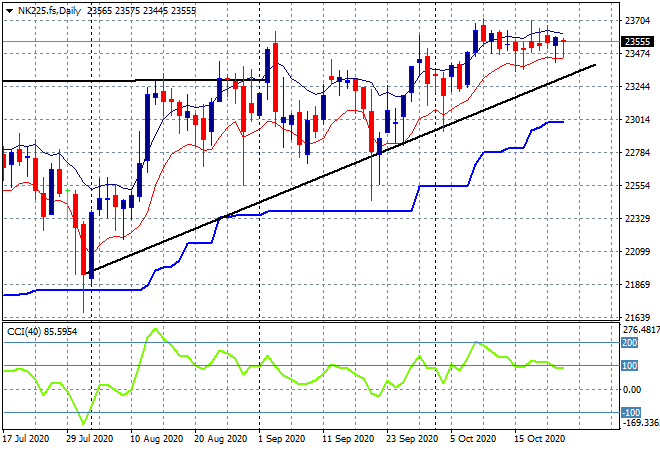
Japanese stock markets put in a weak end to the trading week with the Nikkei 225 closing nearly 0.2% higher at 23516 points. Resistance continues to be stubborn around the 23500 point level with no new highs in nearly two weeks. It remains to be seen if price can gain any momentum here going into this trading week, so watch the low moving average to possibly come under pressure at the 23400 level:
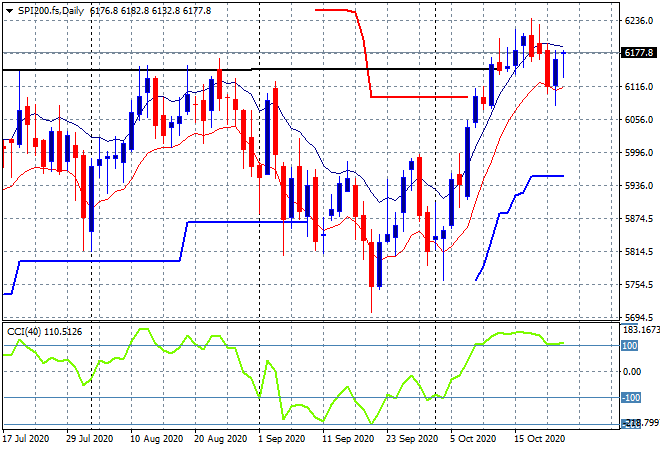
The ASX200 was again unsure of itself, hovering with a scratch session to fall 0.1% and close at 6167 points. Futures are indicating some buying support to start the week as support at the 6100 point level remains firm. Daily momentum was about to rollover from its overbought stage but the low moving average has been respected so far:
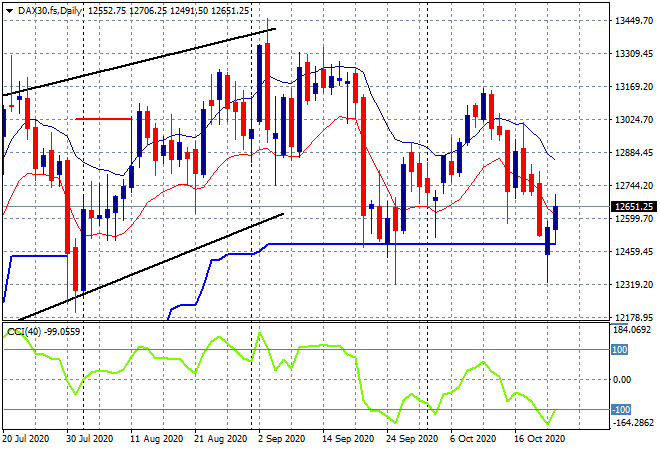
European markets finally found some life after falling nearly all week with the German DAX representative of the gains to finish 0.8% higher at 12645 points. The daily chart is still in rollover phase with momentum oversold but it appears daily ATR support at the 12500 point level is firming as a possible bottom pattern:
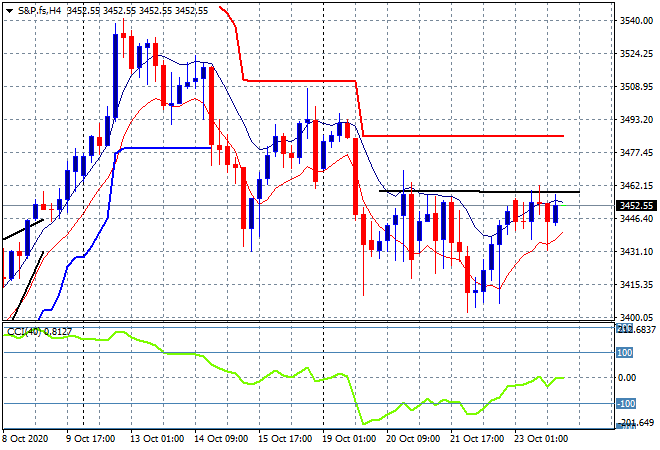
Wall Street is still hoping like crazy that some form of stimulus can be enacted before the election with the S&P500 closing 0.3% higher at 3465 points. The four hourly chart show how price has been unable to clear the early week highs although it still firming above the 3400 point support level. Notionally, this is a bullish short term picture:
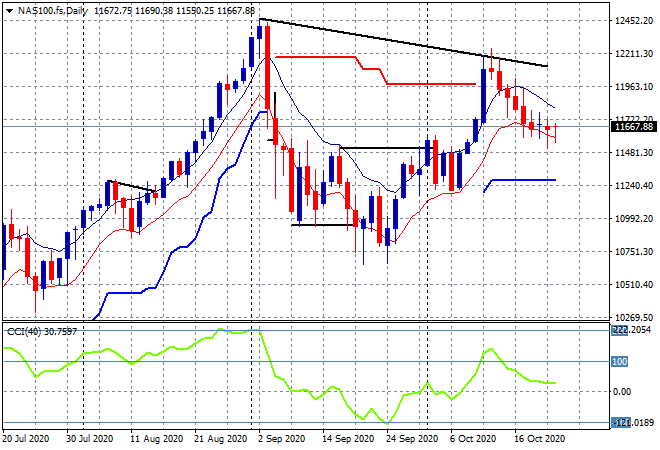
The NASDAQ managed the same weak result, up only 0.3% with the daily chart showing is barely clinging on here as it still points to a possible retracement down to the early September lows around 10700 points:
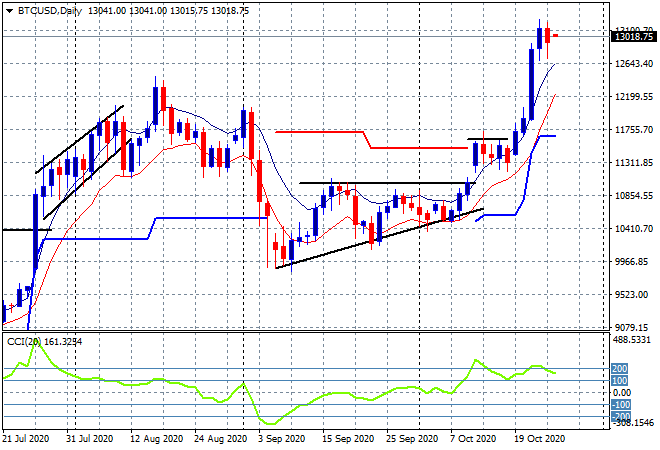
Bitcoin’s spectacular breakout has paused just above the $13000 level after clearing the August highs. As I said late last week, this is way overextended and would normally result in a retracement. but Bitcoin is not normal!
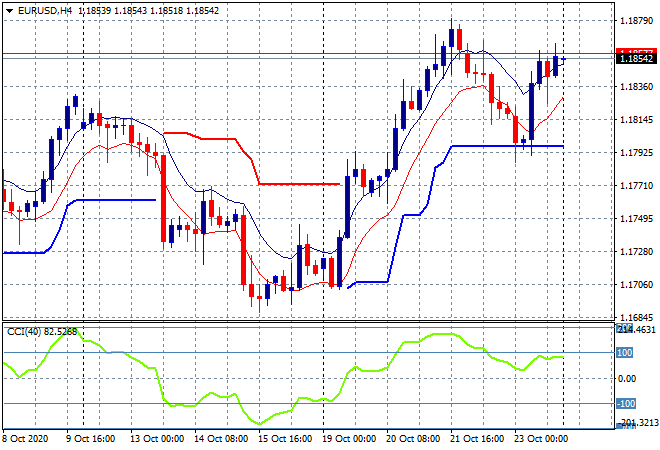
Volatility in currency markets came back against USD with Euro bouncing off the 1.18 handle on Friday night after its mid week retracement due to better than expected flash PMI prints. Price is still below the mid-week high so while momentum remains nominally positive there is a chance of a failed follow through here on the weekend gap open:
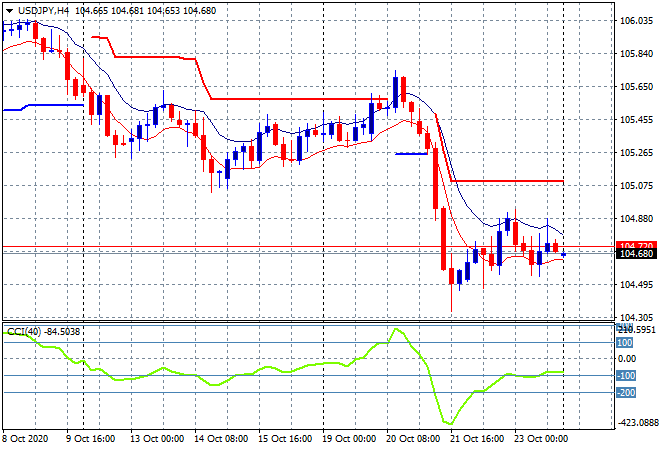
The USDJPY pair was basically unchanged, still depressed below the 105 handle after previously losing over 100 pips in the mid week rout. Momentum is still oversold and not showing signs yet of a new rally, but I’m watching the high moving average and recent session highs as a signal for a potential swing trader back up to trailing ATR resistance at the 105.10 level:
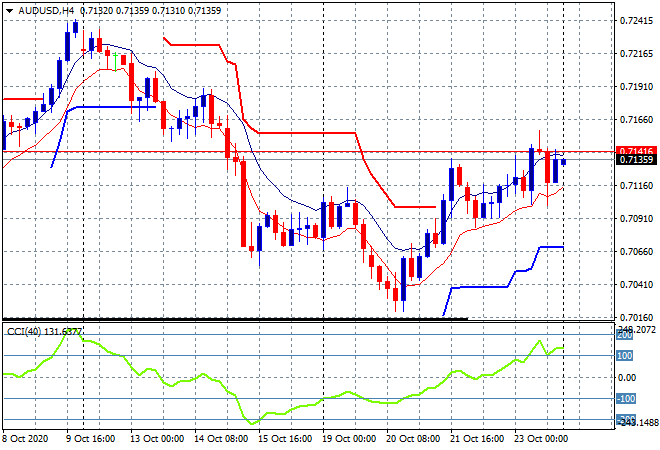
The Australian dollar was able to put on mild gains on Friday night, hampered by the falls in commodity prices. It ended up making a new weekly high but in context is still well off its recent highs. Momentum is slightly overbought and could potentially signal a break below the low moving average here as we go into the end of month:
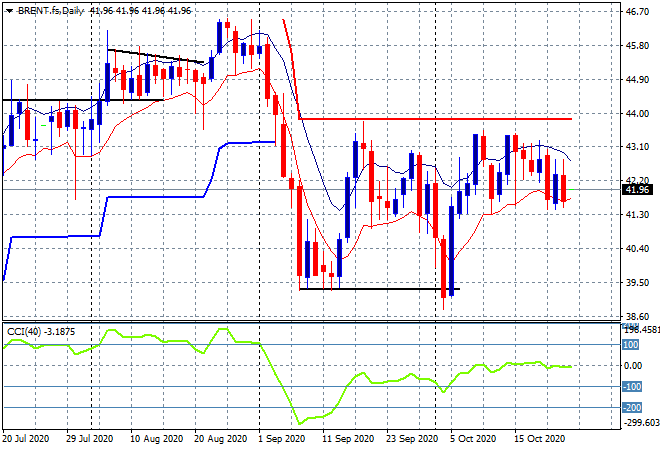
Oil volatility continues to go the unexpected wrong way with another slump in prices on Friday night, as Brent futures retraced back below the $42USD level, as it again failed to match the previous daily highs. My theory of a breakout release above long held resistance at the $44USD level is no longer valid, which should lead to more long positions abandoned, so watch that lower moving average line to come under stress:
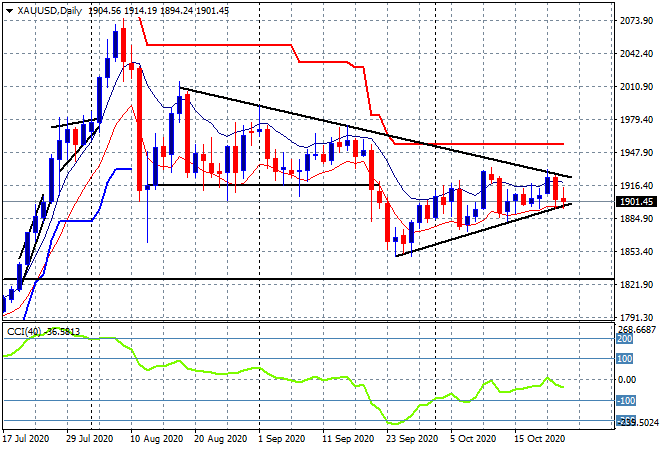
Gold was unable to hold on above the $1900USD per ounce level, heading below before recovering ever so slightly. The daily chart is again morphing into a symmetrical triangle pattern as weakening buying support below is still weighed down by selling above at the $1920 zone, which needs to be cleared very soon:
Glossary of Acronyms and Technical Analysis Terms:
ATR: Average True Range – measures the degree of price volatility averaged over a time period
ATR Support/Resistance: a ratcheting mechanism that follows price below/above a trend, that if breached shows above average volatility
CCI: Commodity Channel Index: a momentum reading that calculates current price away from the statistical mean or “typical” price to indicate overbought (far above the mean) or oversold (far below the mean)
Low/High Moving Average: rolling mean of prices in this case, the low and high for the day/hour which creates a band around the actual price movement
FOMC: Federal Open Market Committee, monthly meeting of Federal Reserve regarding monetary policy (setting interest rates)
DOE: US Department of Energy
Uncle Point: or stop loss point, a level at which you’ve clearly been wrong on your position, so cry uncle and get out!