

Wall Street was able to find some confidence overnight even though there was still no progress on fiscal stimulus measures. European stocks were flat at best while the USD returned to strength, mainly due to the fall in Euro. Commodities were again mixed with oil coming back while copper fell alongside gold, while Bitcoin shoots to the moon.
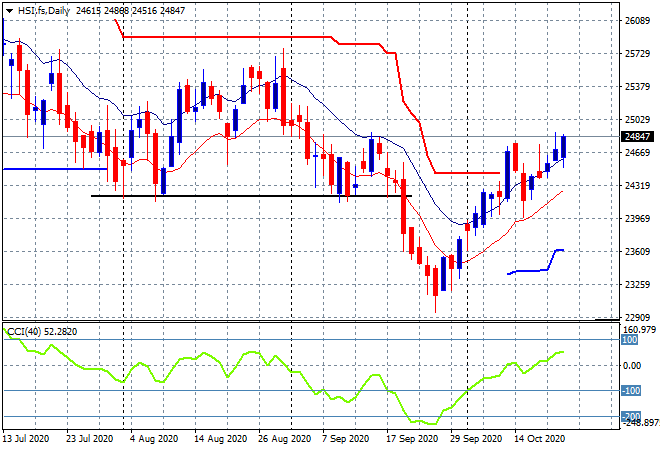
Looking at share markets in Asia from yesterday’s session where the Shanghai Composite struggled to gain momentum, down 0.2% to close at 3312 points while in Hong Kong the Hang Seng Index was flat, up only a handful of points to be at 24786. The daily chart shows the market in a growing uptrend with former support at the 24200 point level building again as momentum starts to pick up. I’m watching for a proper breakout above the 24800 point level next:
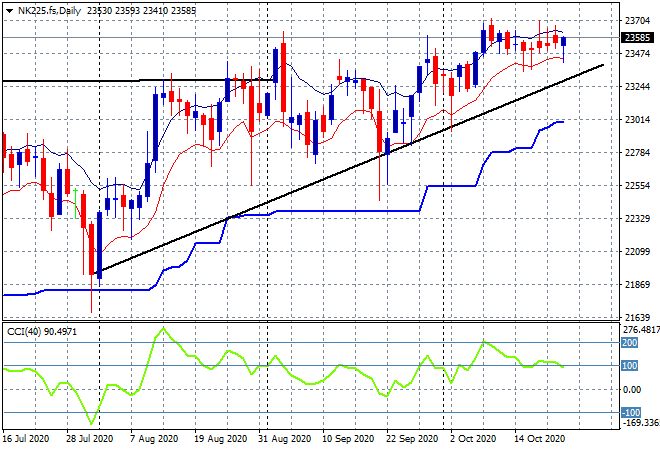
Japanese stock markets have lost all of their previous gains with the Nikkei 225 closing almost 0.8% lower at 23474 points. Resistance remains stubborn around the 23500 point level with no new highs in nearly two weeks as futures suggest a mild fill in of the previous losses in today’s session. I’m still watching the low moving average to possibly come under pressure at the 23400 level:
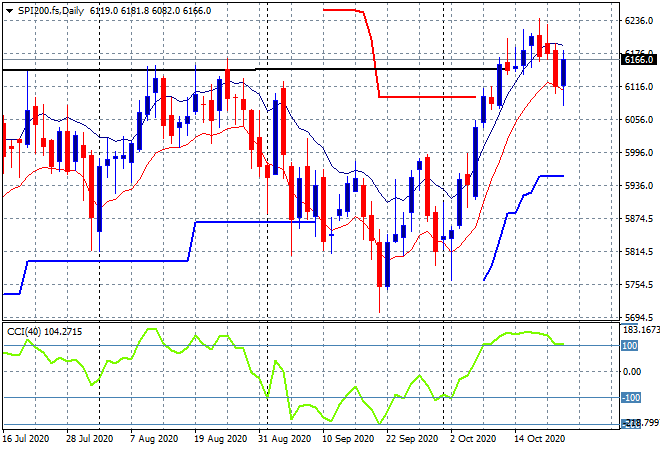
The ASX200 was again unsure of itself, eventually closing only 0.3% lower to 6173 points. Futures are indicating a some further support here as support at the 6100 point level firm. Daily momentum is about to rollover and any break below the low moving average could spell trouble:
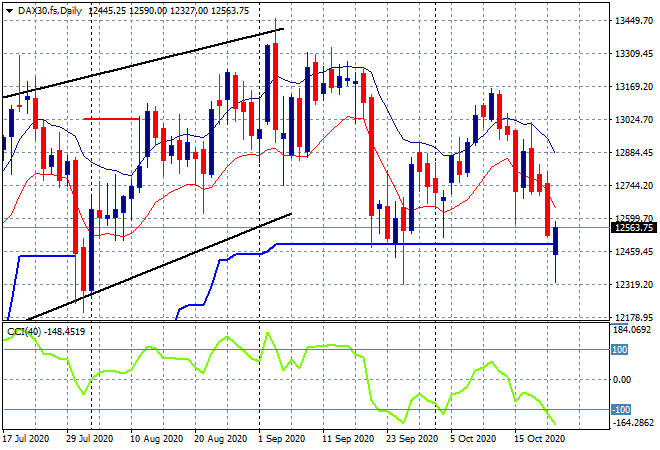
European markets remained in a holding pattern after their previous selloffs with the German DAX drifting to finish only 0.1% lower to 12543 points. The daily chart is still in rollover phase with momentum oversold but it appears daily ATR support at the 12500 point level is becoming a possible bottom pattern:
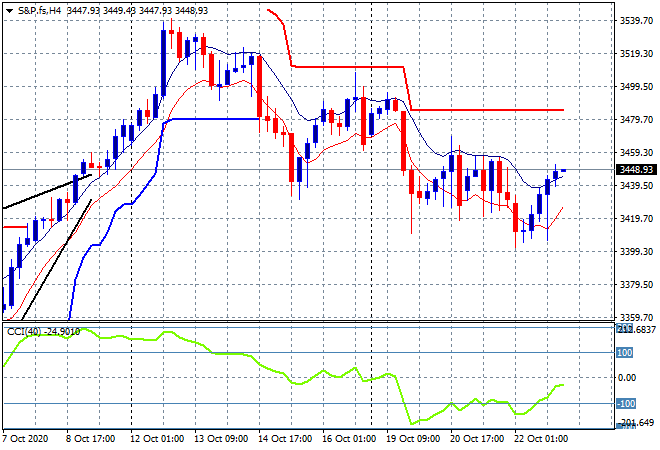
Wall Street remains transfixed on hopes of economic stimulus but managed to put in some gains on the back of firm house sales. The S&P500 closed 0.5% higher at 3453 points with the four hourly chart showing price bouncing off the 3400 point support level but failing to get back to the early week highs:
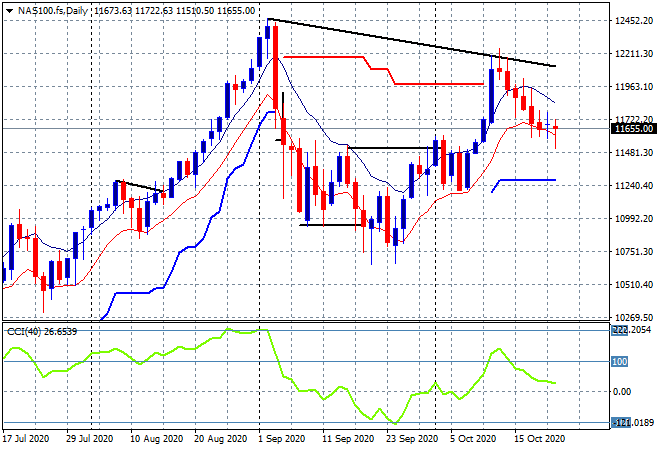
The daily chart of the NASDAQ – which only managed a meager 0.2% gain – is still pointing to a possible retracement down to the earl September lows around 10700 points:
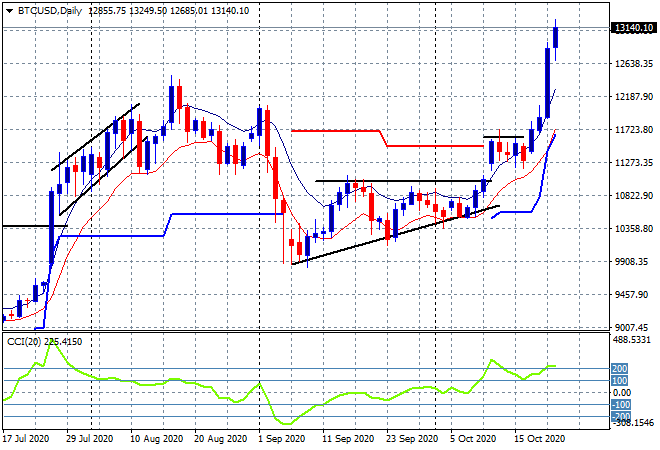
Bitcoin’s breakout has now turned spectacular, surging above the $13000 level and the August highs proper – this is way overextended and would normally result in a retracement:
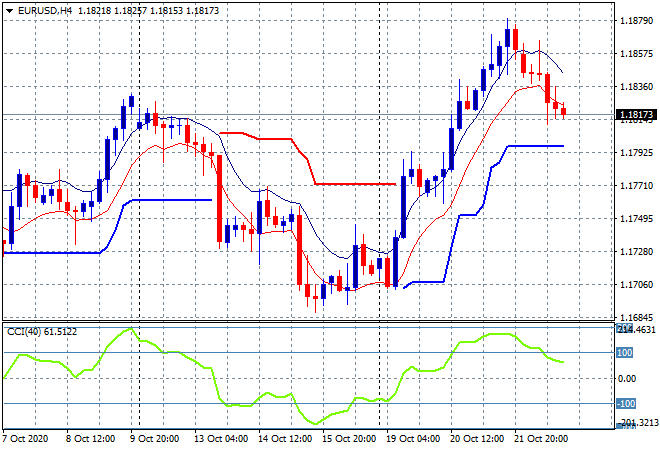
Volatility in currency markets remains high with USD reversing its previous broad selloff, mainly due to Euro which flipped back down to finish just above the 1.18 handle this morning. The overextended move was ripe for a retracement and now we wait to see if trailing four hourly ATR support can hold herel:
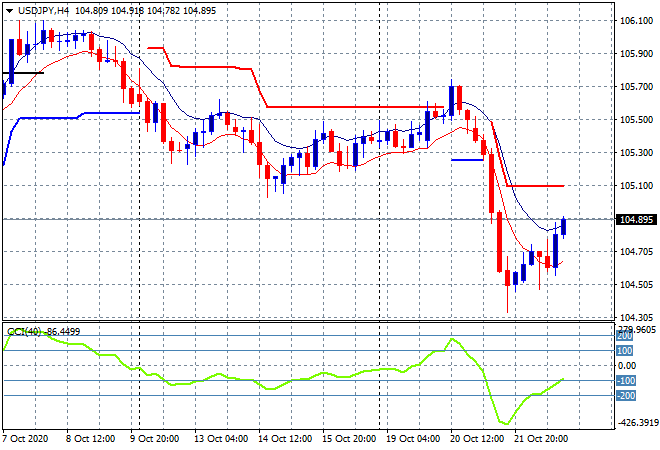
The USDJPY pair is coming back with a nice swing play overnight, almost breaking back above the 105 handle after previously losing over 100 pips. This is the sort of volatility FX traders love! Momentum is still oversold and not showing signs yet of a new rally, but I’m watching trailing ATR resistance at the 105.10 level closely:
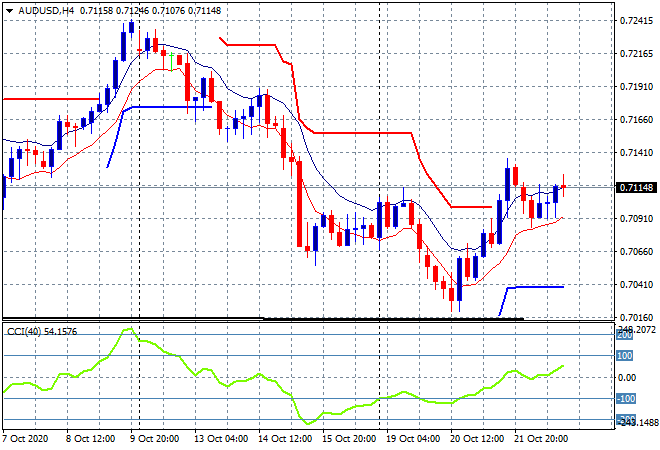
The Australian dollar was steady overnight, holding just above the 71 handle but not able to advance on its previous mid week high. Momentum is slowly picking up so we could see that level at 71.30 re-tested today going into the end of week trading:
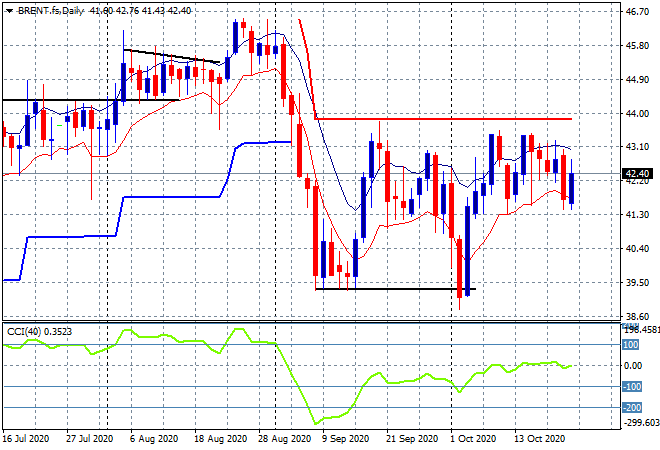
Oil volatility is abating somewhat with Brent futures coming back slightly to finish just above the $42USD level overnight, but still unable to match the previous daily highs. As I said yesterday, my idea of a release above long held resistance at the $44USD level maybe breaking down, so watch that lower moving average line to come under stress:
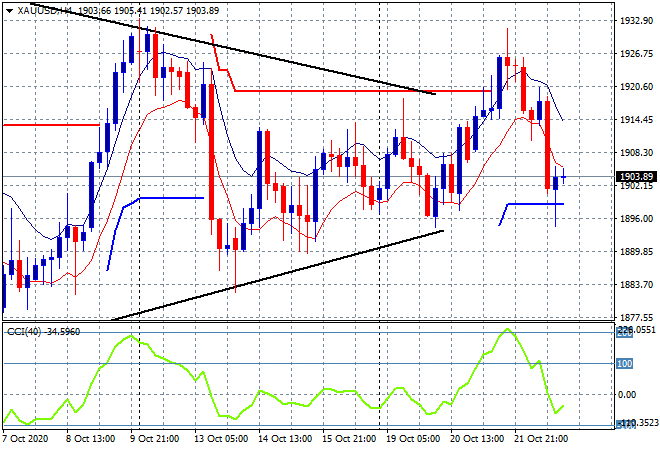
Gold was unable to hold on to its large break above the $1900USD per ounce level overnight, heading slightly below before recovering ever so slightly this morning. The four hourly chart showed an extremely overextended move that has resulted in an oversold short term retracement. Watch the $1900 level which must firm as medium term support:
Glossary of Acronyms and Technical Analysis Terms:
ATR: Average True Range – measures the degree of price volatility averaged over a time period
ATR Support/Resistance: a ratcheting mechanism that follows price below/above a trend, that if breached shows above average volatility
CCI: Commodity Channel Index: a momentum reading that calculates current price away from the statistical mean or “typical” price to indicate overbought (far above the mean) or oversold (far below the mean)
Low/High Moving Average: rolling mean of prices in this case, the low and high for the day/hour which creates a band around the actual price movement
FOMC: Federal Open Market Committee, monthly meeting of Federal Reserve regarding monetary policy (setting interest rates)
DOE: US Department of Energy
Uncle Point: or stop loss point, a level at which you’ve clearly been wrong on your position, so cry uncle and get out!