

With less than two weeks to go until the US elections, risk markets are still swayed by any hopium around a further stimulus package from Congress, with further talks overnight pushing markets and then post-close futures this morning. Wall Street notionally closed higher but has slumped again this morning. Commodities have lifted however on the optimism, with oil and copper rising 2% while Treasuries have sold off, sending the US 10 year to a 0.8% yield and Bitcoin is ready to cross the $12000 mark.
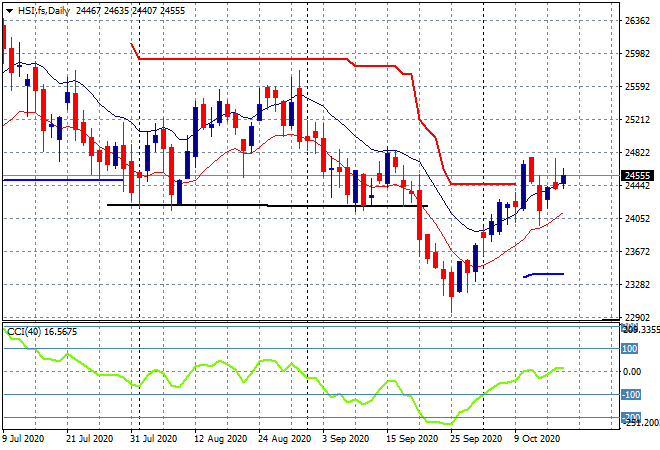
Looking at share markets in Asia from yesterday’s session where the Shanghai Composite was struggling throughout the day but found some momentum at the close to finish 0.5% higher at 3316 points while in Hong Kong the Hang Seng Index was dragged only to just pip up above a scratch session, closing 0.1% higher at 24569 points. The daily chart shows the market ostensibly in a growing uptrend with former support at the 24200 point level building again as momentum starts to pick up. I’m watching for a proper breakout above the 24800 point level next:
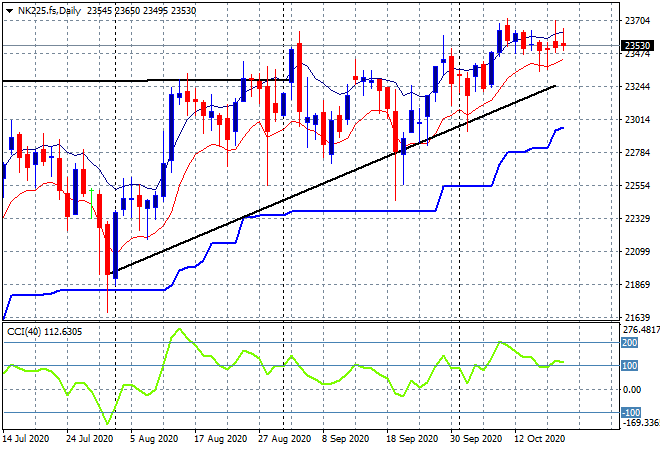
Japanese stock markets fell back as the stall continues on the Nikkei 225, losing almost 0.5% to close at 23567 points. Resistance remains stubborn around the 23500 point level with no real movement in nearly two weeks – continue to watch the low moving average to possibly come under pressure at the 23400 level:
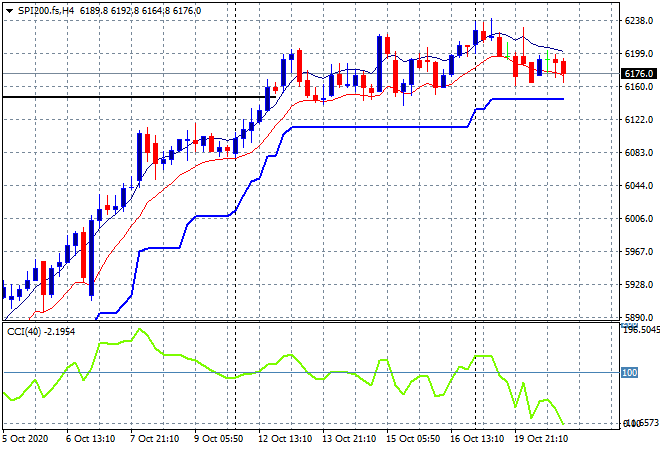
The ASX200 also took back all its start to the week gains to fall nearly 0.8%, finishing at 6184 points. Futures are indicating a pullback in line with Wall Street on the open, but this could swing wildly on any change in sentiment or news. The four chart shows momentum is ready to rollover so watch for a potential pullback towards the former resistance, now tentative support level at 6150 points:
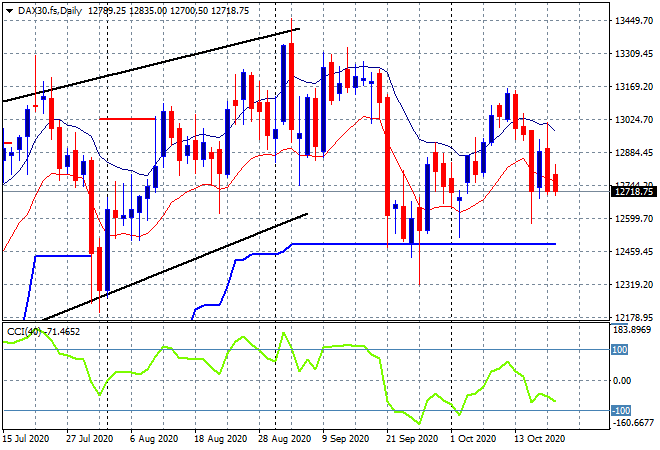
European markets were mixed with a handful of scratch sessions but overall, continental stocks fell back again with the German DAX finishing nearly 1% lower to 12736 points, extending losses in post close futures. The daily chart is slowly rolling over here with momentum gaining to the downside as price falls back to daily ATR support at the 12500 point level:
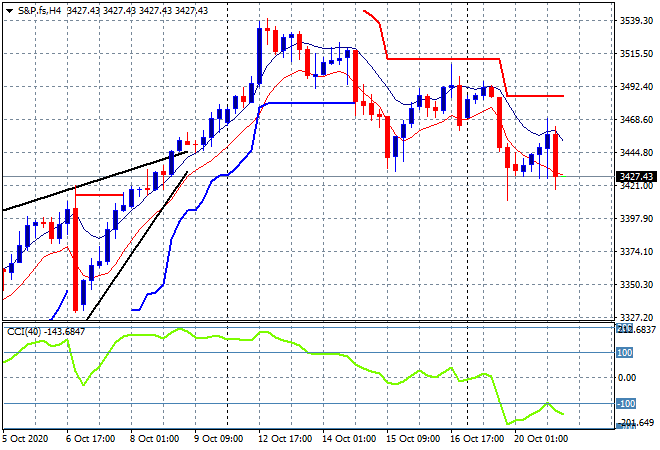
Wall Street is still looking tenuous here as they await the refilling of the punchbow. The S&P500 eventually closed 0.5% higher at 3443 points but the four hourly chart clearly shows post close futures pulling that back down to the previous closing point, with more machinations occurring this morning. I’m watching for a further fall down to 3400 points:
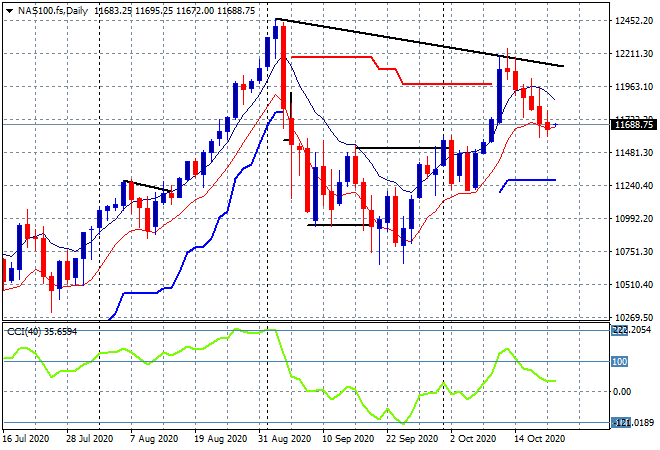
The daily chart of the NASDAQ – which only gained 0.3% before losing all that as well – is again more illustrative of the short term risk picture. The simple downtrend of lower daily highs is pointing to a rollover here – watch the low moving average for the breaking point:
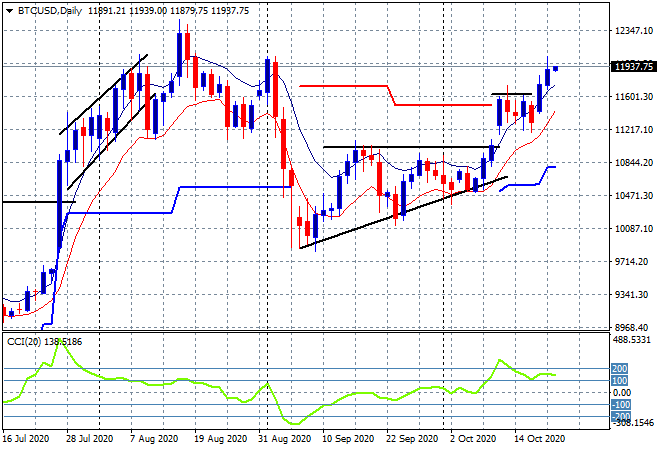
Bitcoin’s breakout continues with the potential to surge above the $12000 level and setting up for a return to the August highs:
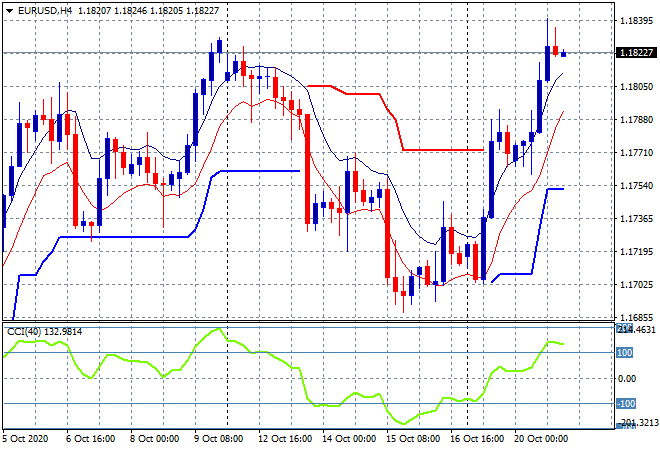
Volatility in currency markets remains high with USD selling in some quarters, as the Euro continued its spike through the 1.18 handle overnight to match its previous weekly highs level. This is looking overextended now with the tell tale signs of a rollover as no new session highs since the 1.18 handle was breached:
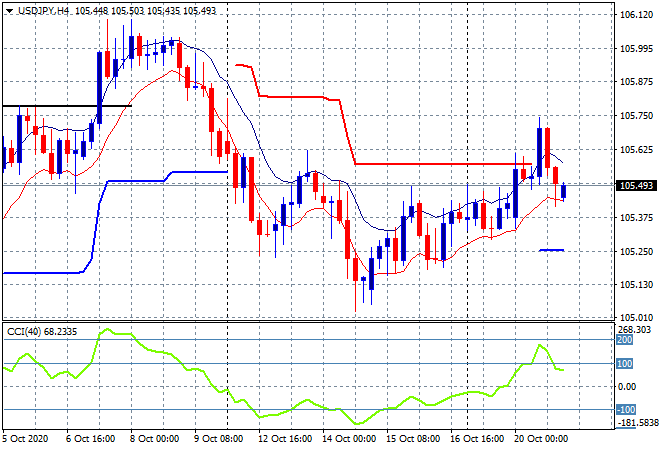
The USDJPY pair put in a false breakout, lifting through ATR resistance at the 105.60 area before retracing and then some back to its Monday morning starting point below the mid 105s again. With momentum still notionally positive, I’m still watching for another potential breakdown here:
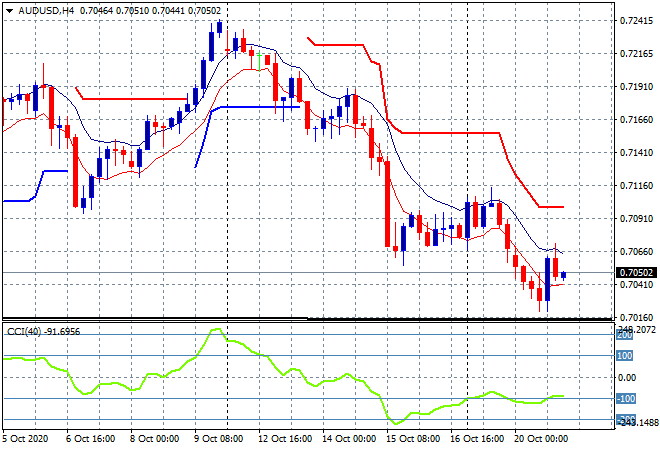
The Australian dollar was unable to make headway again and tried and failed to get back on track with a small swing play up to the 70.60 level before slumping again. The key area to watch on the upside remains the low moving average but I would contend the medium term trend is to break below the 70 handle proper:
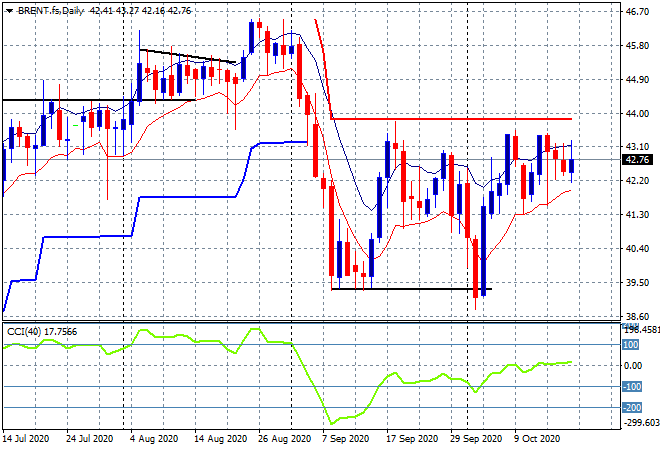
Oil volatility is slowly coiling back again with a small lift higher overnight as Brent futures finished above the mid $42.50USD level. I still contend its poised to breakout above the previous $44 weekly resistance level as momentum is coiling up for a release higher here – but watch that lower moving average line at the $42 level proper:
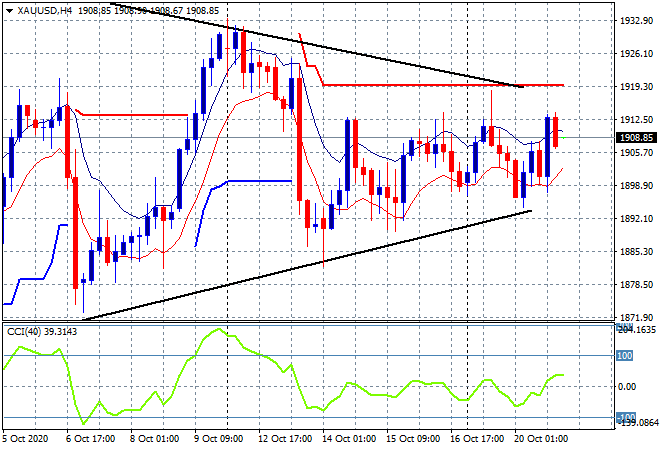
Gold was able to break well above the $1900USD per ounce level again but gave up half of those returns later in the session to finish at the $1908 area. The daily chart is exhibiting an interesting pattern with a large symmetrical triangle forming, possibly pointing to a breakout soon as daily momentum switches into the positive zone.
Glossary of Acronyms and Technical Analysis Terms:
ATR: Average True Range – measures the degree of price volatility averaged over a time period
ATR Support/Resistance: a ratcheting mechanism that follows price below/above a trend, that if breached shows above average volatility
CCI: Commodity Channel Index: a momentum reading that calculates current price away from the statistical mean or “typical” price to indicate overbought (far above the mean) or oversold (far below the mean)
Low/High Moving Average: rolling mean of prices in this case, the low and high for the day/hour which creates a band around the actual price movement
FOMC: Federal Open Market Committee, monthly meeting of Federal Reserve regarding monetary policy (setting interest rates)
DOE: US Department of Energy
Uncle Point: or stop loss point, a level at which you’ve clearly been wrong on your position, so cry uncle and get out!