

The lack of any economic reports and any action of further stimulus measures from the US sent Wall Street and other risk markets lower overnight, as we head into the usually volatile late October period leading up to the US presidential election. Commodities were mixed with oil pulling back slightly while gold and Bitcoin both riser higher against USD. More no-deal Brexit machinations saw Pound Sterling stumble while the Aussie dollar is on the ropes and ready to make a new monthly low.
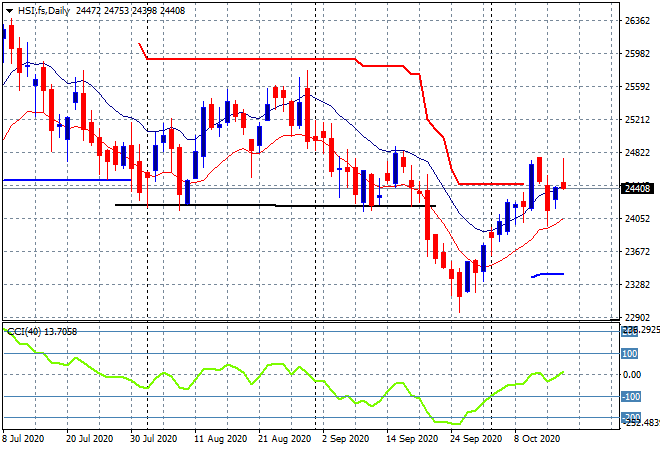
Looking at share markets in Asia from yesterday’s session where the Shanghai Composite continued to struggle amid the poor GDP print, down nearly 0.8% to close at 3312 points while in Hong Kong the Hang Seng Index rebounded, closing up 0.6% to 24542 points. The daily chart shows the market poised here at former support at the 24200 point level where it needs to follow through with another upside session as momentum wanes just below the positive setting:
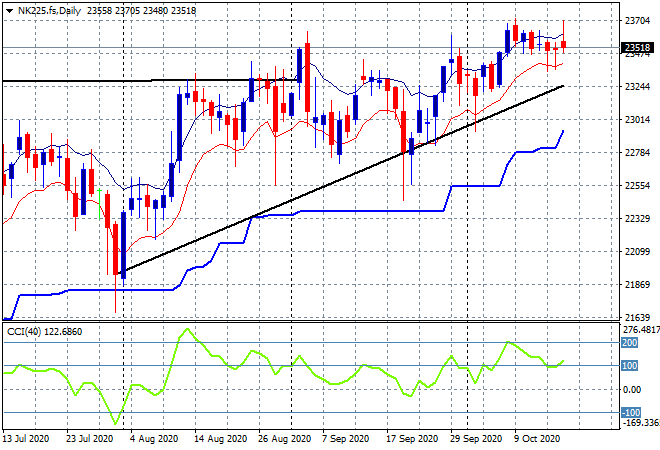
Japanese stock markets moved in line with US futures with the Nikkei 225 gaining over 1% to close at 23671 points as Yen buying abated somewhat. Recent price action had created a new monthly high amid a solid uptrend since the July lows but futures are indicating a pullback here as resistance remains stubborn around the 23500 point level. Watch the low moving average to come under pressure at the 23400 level:
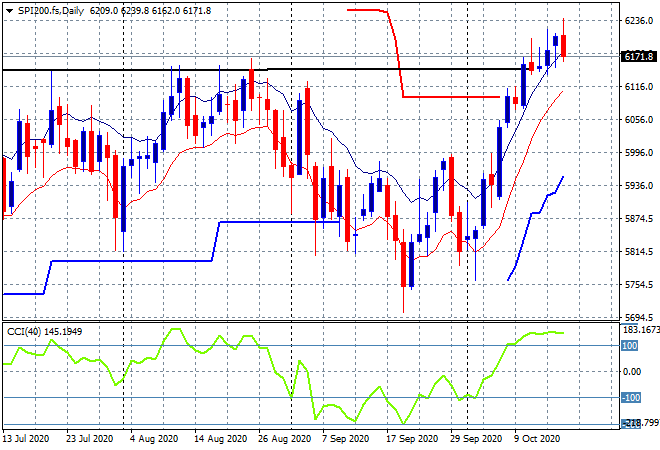
The ASX200 also took back its previous losses to gain nearly 0.9%, finishing at 6229 points. Futures are indicating a pullback in line with Wall Street on the open, as the daily chart shows price is still well overextended as momentum is ready to rollover. Watch for a potential pullback towards the former resistance, now tentative support level at 6150 points:
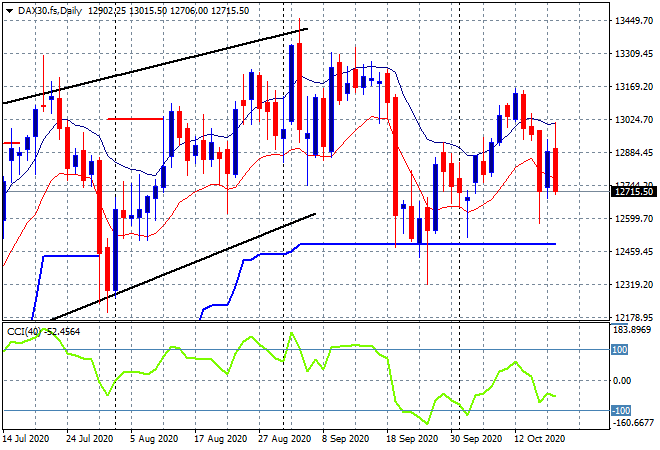
European markets took back all of their Friday surge with most markets falling half a percent or more, the German DAX finishing nearly 0.5% lower to 12854 points, extending those losses in post close futures. The daily chart remains mixed at best with momentum still in negative mode as price wants to get back to daily ATR support at the 12500 point level:
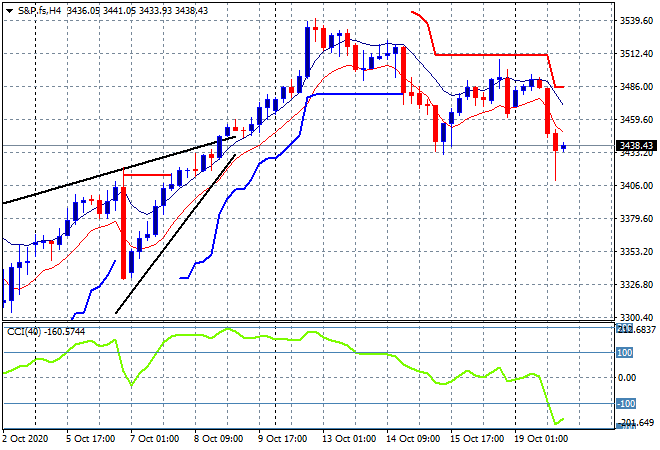
Wall Street is looking tenuious here at best with co-ordinated falls across the three main markets as the punchbowl remains empty. The S&P500 eventually closed 1.6% lower at 3426 points with the four hourly chart showing how price has been unable to breach overhead resistance at the 3500 point level and has now cracked to a two week low. I’m watching for a further fall down to 3400 points:
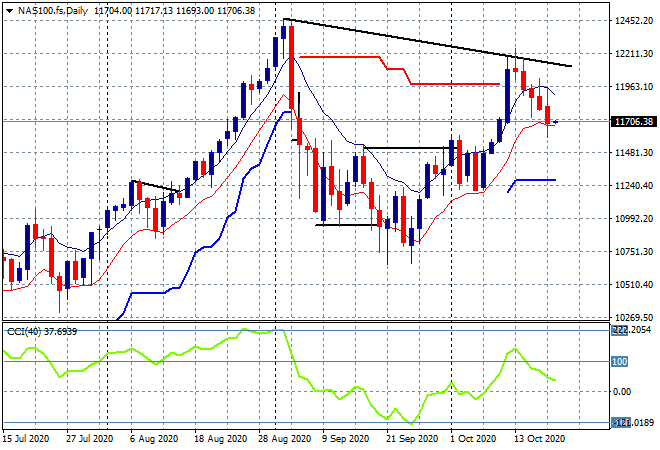
The daily chart of the NASDAQ – which fell 1.6% as well – is again more illustrative of the short term risk picture. The simple downtrend of lower daily highs is pointing to a rollover here – watch the low moving average carefully:
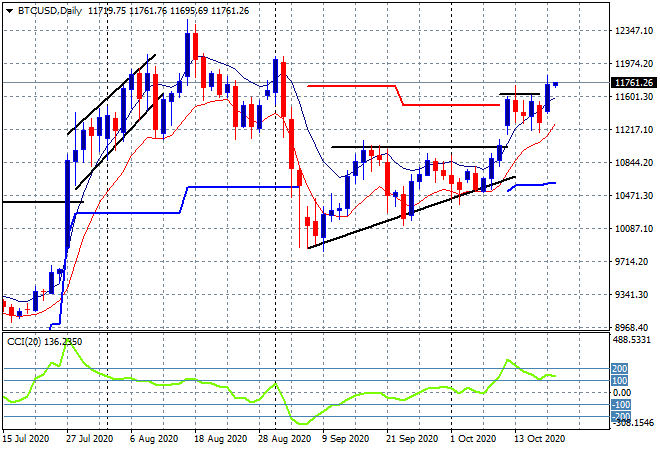
Bitcoin’s breakout setup has won out to the upside with a surge up towards the $12000 level overnight, punching through the key $11600 level:
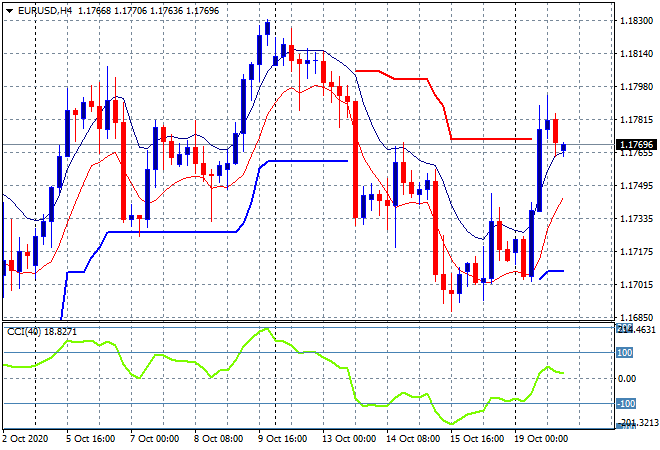
Volatility in currency markets came back strongly despite the lack of economic releases with traders hinging on ECB and other Fed official speeches overnight, but also the continued uncertainty around COVID on the continent. Euro spiked back up towards the 1.18 handle overnight and is looking firm but not yet overextended here:
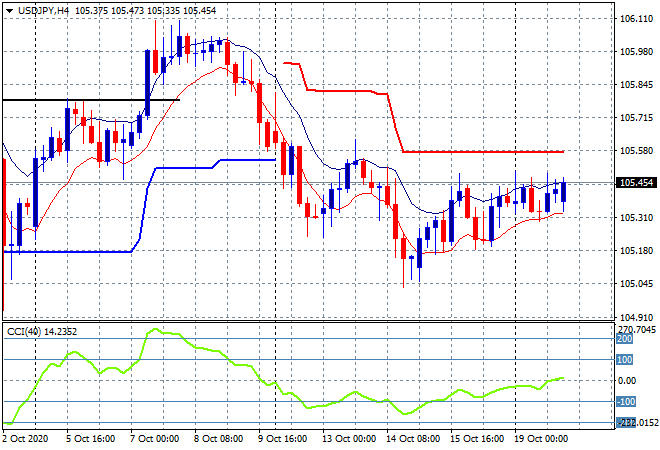
The USDJPY pair was able to glide slightly higher, still stuck below the mid 105 level again as overhead resistance remains relatively firm. Momentum is slowly picking up but this is a very staid pair to watch at the moment with a breakout above ATR resistance at the 105.60 the area to watch:
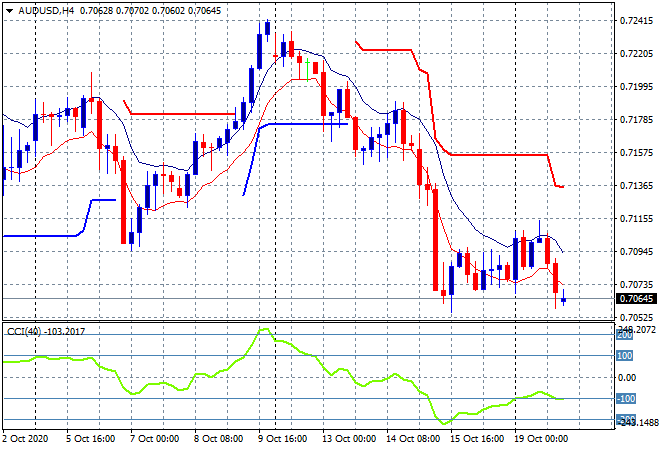
The Australian dollar was unable to make headway and was pushed even lower overnight, thwarting any attempt at a low probability swing above the 70.90 level as another breakdown is building here below the 70.60 level instead:
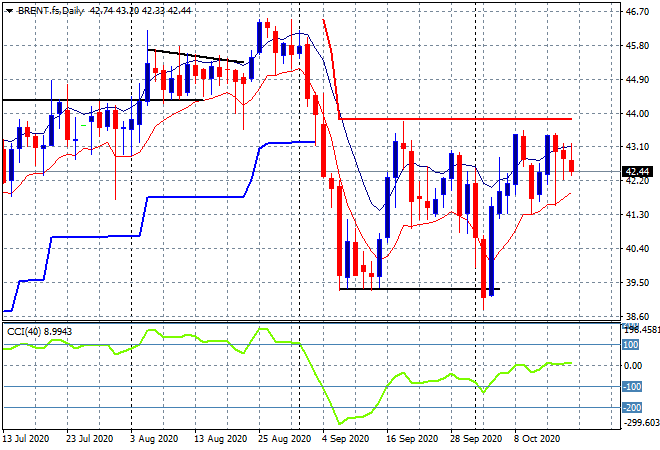
Oil volatility is slowly coiling back again with a minor pullback overnight as Brent futures fell slightly to finish at the mid $42.50USD level. I still contend its poised to breakout above the previous $44 weekly resistance level as momentum is coiling up for a release higher here – but watch that lower moving average line at the $42 level proper:
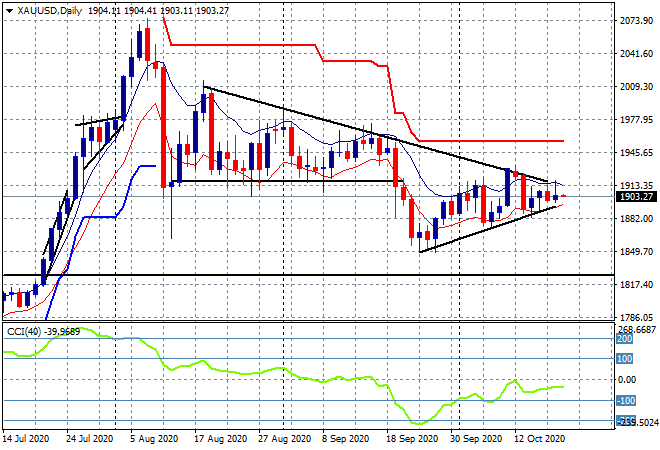
Gold was able to get back above the $1900USD per ounce level again but USD remains too strong as this weak sideways trend continues. The daily chart is exhibiting an interesting pattern with a large symmetrical triangle forming, possibly pointing to a breakout soon. Daily momentum remains in the negative zone however, so probability points to a rollover below the $1880 level:
Glossary of Acronyms and Technical Analysis Terms:
ATR: Average True Range – measures the degree of price volatility averaged over a time period
ATR Support/Resistance: a ratcheting mechanism that follows price below/above a trend, that if breached shows above average volatility
CCI: Commodity Channel Index: a momentum reading that calculates current price away from the statistical mean or “typical” price to indicate overbought (far above the mean) or oversold (far below the mean)
Low/High Moving Average: rolling mean of prices in this case, the low and high for the day/hour which creates a band around the actual price movement
FOMC: Federal Open Market Committee, monthly meeting of Federal Reserve regarding monetary policy (setting interest rates)
DOE: US Department of Energy
Uncle Point: or stop loss point, a level at which you’ve clearly been wrong on your position, so cry uncle and get out!