

Wall Street finished Friday night with a fizzer, despite a very strong US retail sales print with European markets putting in a better result. Industrial production for September disappointed however, sending all the industrial metals down and bond yields rose slightly higher. A mixed finish to the trading week with the lack of firm upside from Wall Street possibly putting a halt on risk taking here as Asia opens a new trading week.
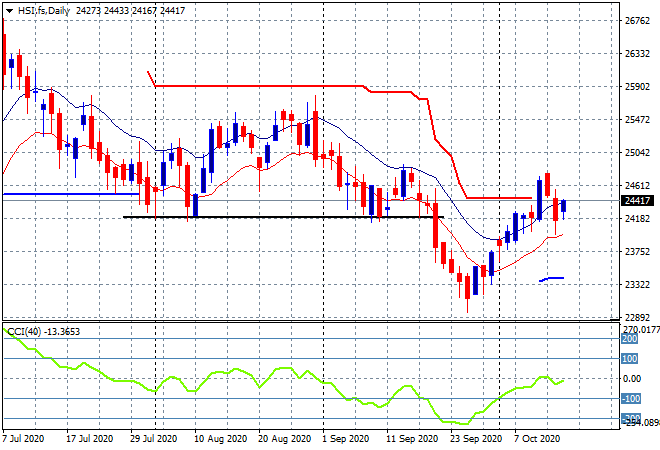
Looking at share markets in Asia from Friday’s session where the Shanghai Composite struggled to hold onto a positive result with a scratch effort at 3336 points while in Hong Kong the Hang Seng Index took back its previous losses to gain almost 1% to 24386 points. The daily chart shows the market poised here at former support at the 24200 point level where it needs to follow through with another upside session as momentum wanes just below the positive setting:
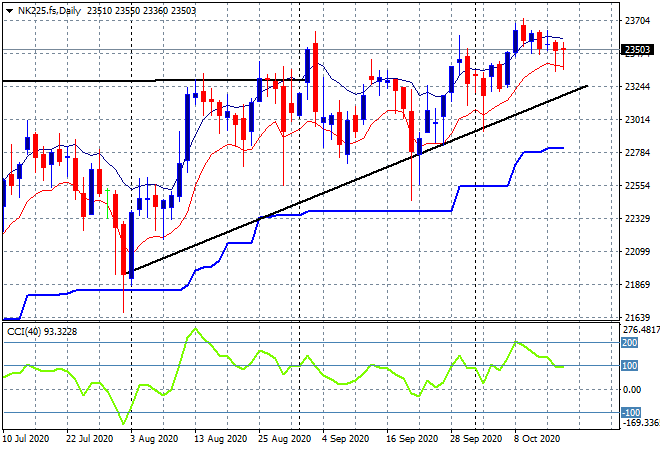
Japanese stock markets slipped with the Nikkei 225 falling another 0.4% to close at 23410 points as Yen buying held risk taking back. Recent price action had created a new monthly high amid a solid uptrend since the July lows but futures are yet again indicating a stall here as resistance remains stubborn around the 23500 point level:
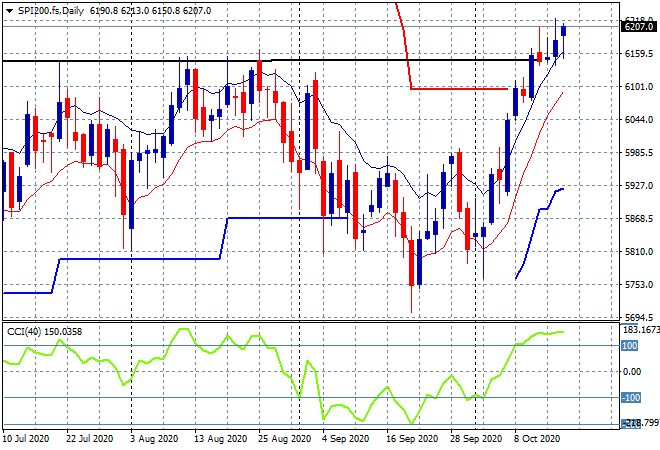
The ASX200 also took back its previous gains to fall 0.5% to finish at 6176 points, capping off a very strong week that took it well above the previous resistance and June highs at the 6150 point level. The daily chart shows the market is well overextended and ready to consolidate a little bit here to catch its breath, with momentum a little overdone. Watch for a potential pullback towards the former resistance, now tentative support level:
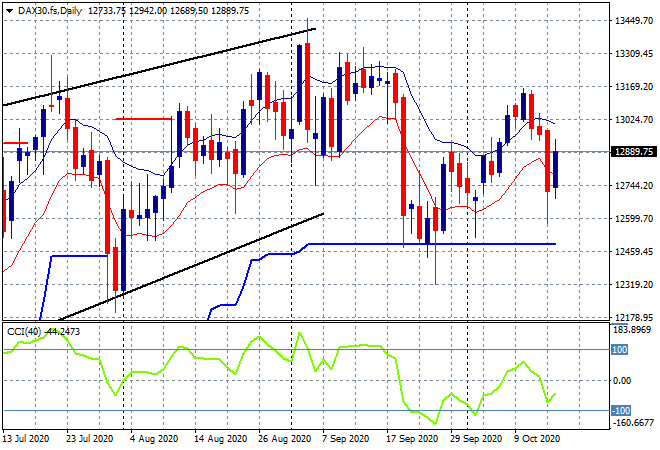
European markets came back in a relatively strong surge with most markets putting on at least 1% or more, the German DAX finishing nearly 1.7% higher to 12903 points, clawing back some of its previous big reversal. The daily chart is mixed at best with momentum still in a bad negative space although daily ATR support at the 12500 point level remains firm, we’re likely to flat line here:
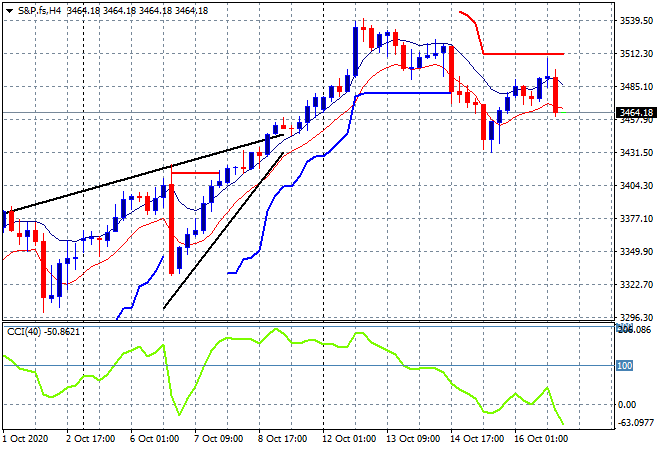
Wall Street can’t get out of its own funk, with a solid session then pulled back later on as risk taking abated. The S&P500 eventually closed dead flat at 3483 points but fell further in post close futures. The four hourly chart shows how price was ready to make an attempt at overhead resistance at the 3500 point level but has been thwarted again as momentum rolled over. Perhaps a Biden win is starting to be factored in? Or was this in response to the faltering “post” COVID recovery as the third wave takes hold:
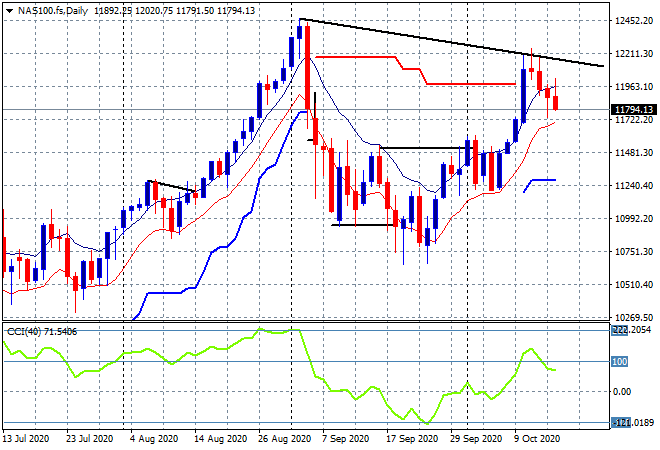
The daily chart of the NASDAQ – which fell 0.4% on Friday night – is again more illustrative of the short term risk picture. The simple downtrend of lower daily highs is pointing to a rollover here:
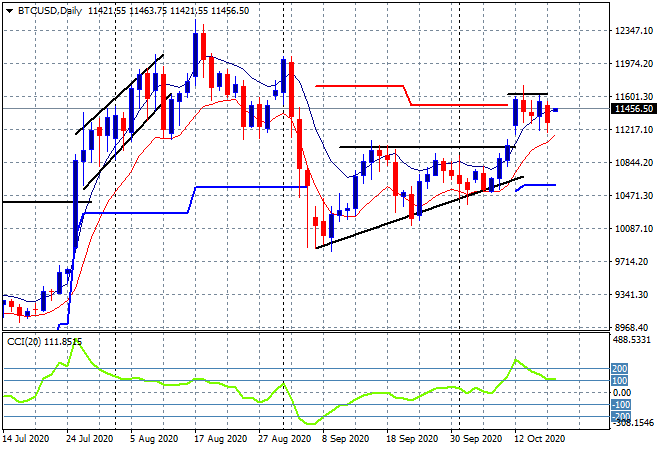
Bitcoin remains poised after its breakout setup last week where price is bunching up after the recent breakout above the previous resistance zone at the $11000 level – can it punch above $11600?
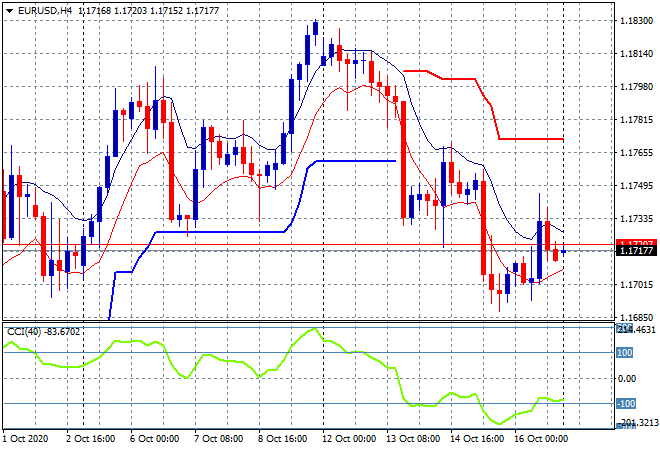
Volatility in currency markets came back on Friday night amid some solid economic reports with Euro spiking towards the mid 1.17 level before pulling back as the trading session finally closed. The retracement of last week’s rally may not yet be over as support at the 1.1730 session lows was decidedly broken, so I’m watching for a break below the 1.17 handle proper:
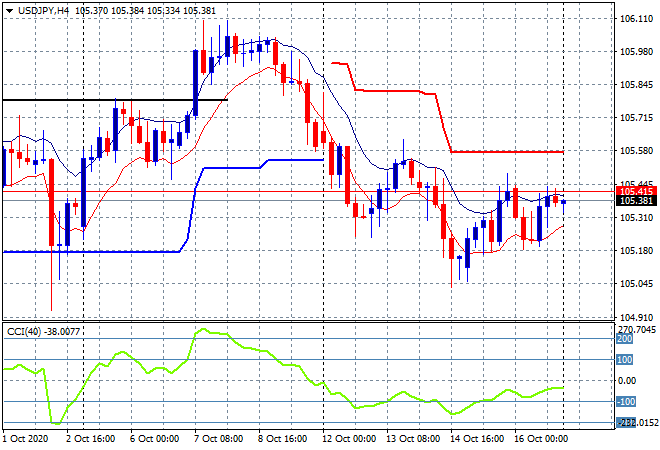
The USDJPY pair was unable to move anywhere, still stuck at the mid 105 level again as overhead resistance remains too strong. Momentum has reverted somewhat from its oversold status but Yen buying may accelerate if stocks continue to fallover:
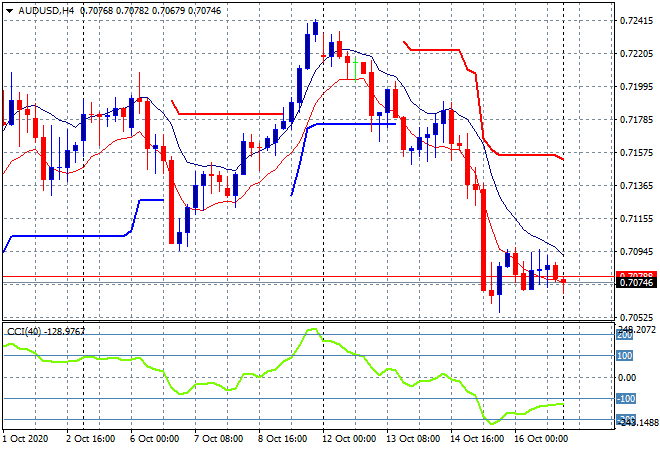
The Australian dollar was unable to come back from its mid week whalloping as it remained below the 71 handle, almost making a new intrasession low in the process as commodities struggled. I’m watching for a low probability swing higher above the 70.90 level but its likely we’ll see another breakdown here:
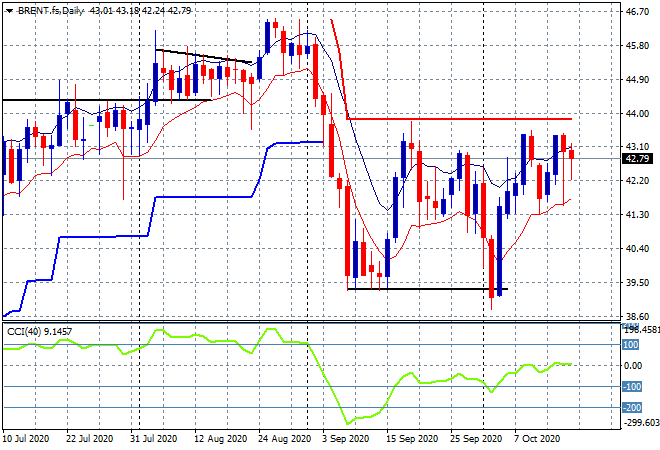
Oil volatility is slowly coiling back again with a minor pullback on Friday night as Brent futures fell slightly to finish just below the $43USD level. I still contend its poised to breakout above the previous $44 weekly resistance level as momentum is coiling up for a release higher here:
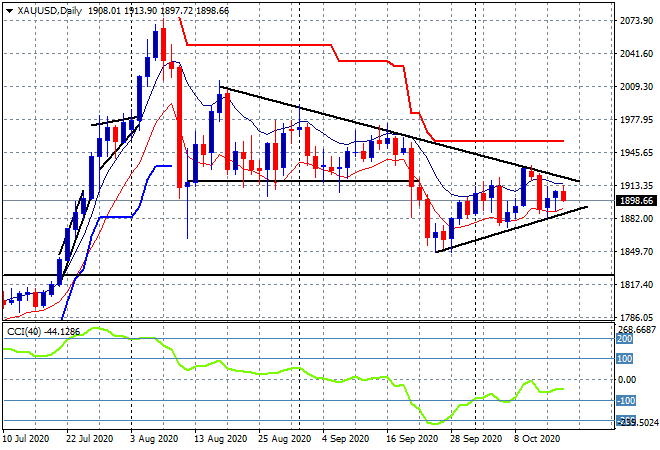
Gold was unable to get back above the $1900USD per ounce level again as USD remained too strong. The daily chart is exhibiting an interesting pattern with a large symmetrical triangle forming, possibly pointing to a breakout soon. Daily momentum remains in the negative zone however, so probability points to a rollover below the $1880 level:
Glossary of Acronyms and Technical Analysis Terms:
ATR: Average True Range – measures the degree of price volatility averaged over a time period
ATR Support/Resistance: a ratcheting mechanism that follows price below/above a trend, that if breached shows above average volatility
CCI: Commodity Channel Index: a momentum reading that calculates current price away from the statistical mean or “typical” price to indicate overbought (far above the mean) or oversold (far below the mean)
Low/High Moving Average: rolling mean of prices in this case, the low and high for the day/hour which creates a band around the actual price movement
FOMC: Federal Open Market Committee, monthly meeting of Federal Reserve regarding monetary policy (setting interest rates)
DOE: US Department of Energy
Uncle Point: or stop loss point, a level at which you’ve clearly been wrong on your position, so cry uncle and get out!