

Friday night saw two bigly events occur – the latest and very disappointing US jobs report, and the farcically unexpected admission that Trump caught the COVID. The latter sent risk markets into a spin late in the afternoon and combined both are providing large volatility spikes across stock, commodity and bond markets. Oil prices continued to flounder of demand concerns as the second wave in Europe gathers pace, while the concern over the forthcoming US presidential election is keeping USD in a holding pattern.
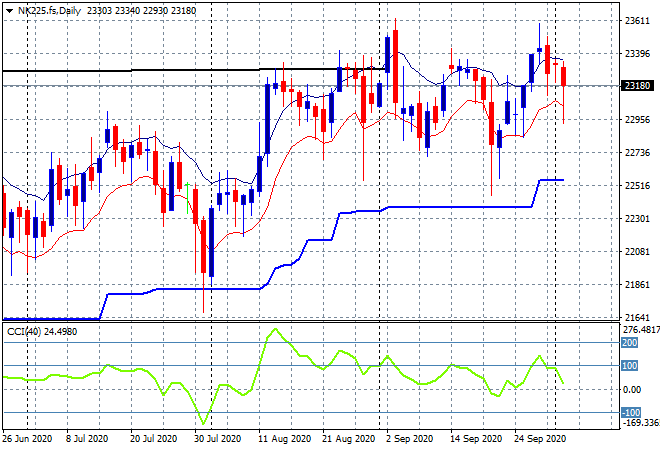
Looking at share markets in Asia from Friday’s session where Chinese markets remain closed for holiday’s while Japanese stock markets returned after their previous technical malfunction with the Nikkei 225 closing nearly 1% lower at 22997 points. Strong resistance at 23300 points remains very firm here and still needs to be cleared for any further upside, so continue to watch the low moving average to act as short term support:
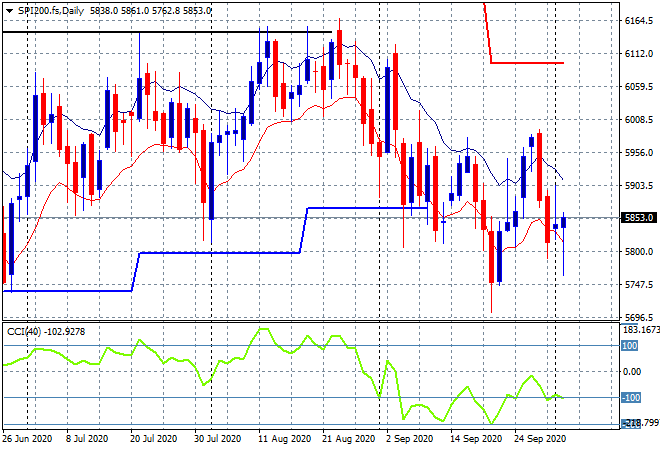
The ASX200 fell further later in the session, having been down already to close out the week 1.4% lower to 5739 points, now off nearly 5% in the last month. SPI futures however are showing a bounceback in the wake of Trump’s “cure” this morning, up nearly 70 points despite falling commodities and the poor US job print. Note how support at the 5750 level and mid-September lows is holding but the 6000 point resistance level remains extremely firm in the medium term:
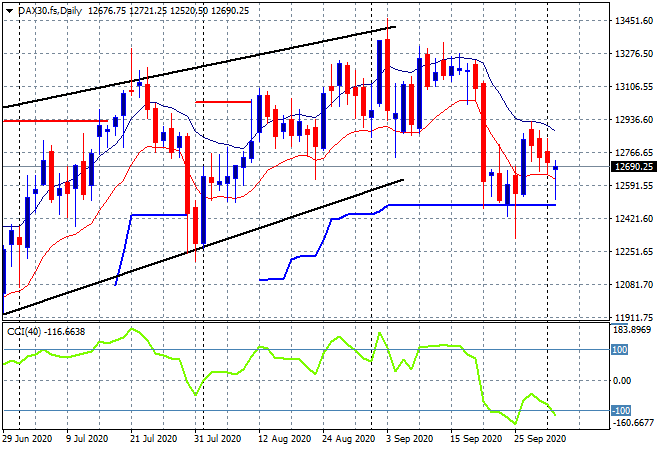
European markets were all over the pace with Brexit and coronavirus concerns still weighing at different levels with the FTSE advancing 0.3% while the German DAX stumbled again to finish 0.3% lower, closing at 12689 points. Futures are indicating a slight fill of those falls with daily price action having broken to the downside of the moving average band but still respecting daily ATR support at the 12400 level. Momentum is quite negative here and ready to breakdown:
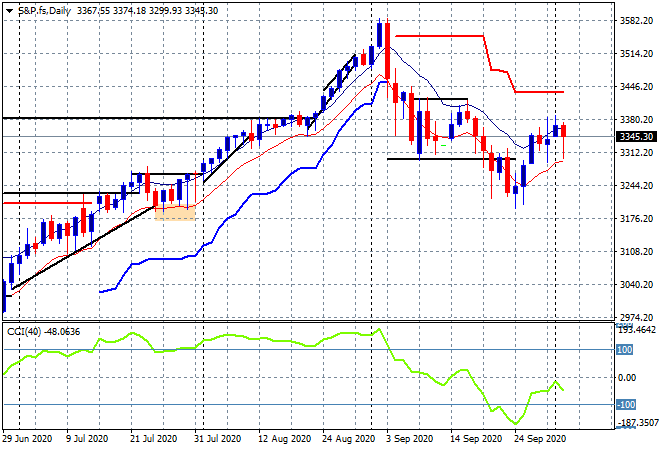
Wall Street immediately fell in pre-open futures on the TrumpVirus news but was able to clawback some of that fear although tech stocks were hammered as the NASDAQ fell over 2% while the S&P500 eventually finished 1% lower at 3348 points. The daily chart shows this move still keeps it above the key psychological 3300 point level and while daily momentum is not yet positive, the moving average band continues to point higher. This week’s trajectory will depend on the outcome of Trump’s physical condition, watch the newsflows carefully (and look beyond the BS the White House is spinning):
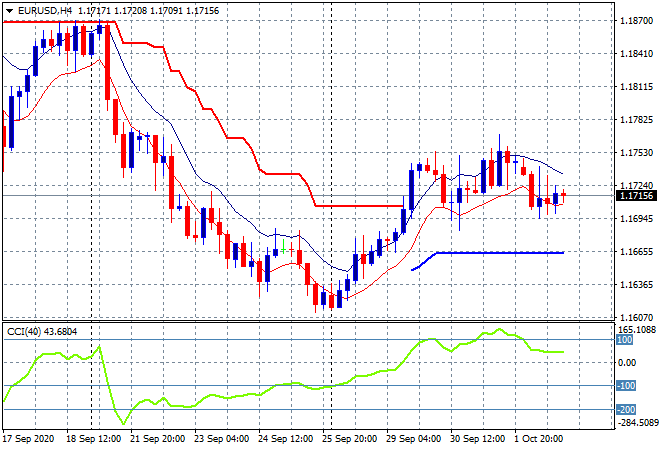
Volatility in currency markets was relatively benign considering the macro catalysts and the NFP print with Pound Sterling relatively stable amid more Brexit ructions while Euro was pushed down towards but not below the 1.17 level. Short term support at this level looks like holding but the overall pattern is meek at best, so I expect another test below 1.17 soon:
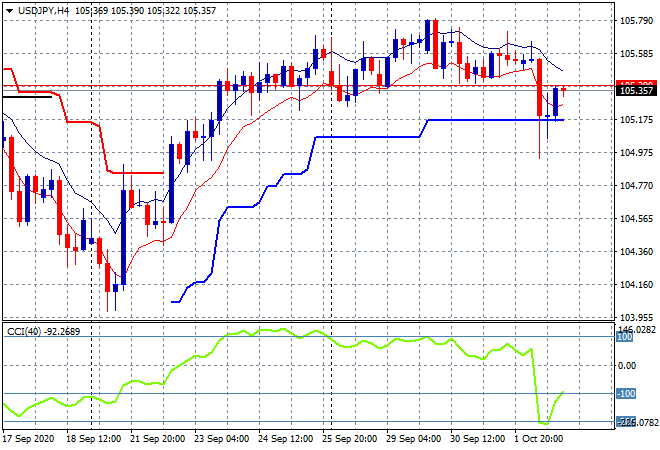
The USDJPY pair however broke down below its own low moving average and what was steady trailing ATR support at the 105 handle before recovering very late on Friday night. Momentum became very oversold and then reverted, but is nowhere near out of the woods yet, so I’m watching for another break below 105 on the weekend gap open:
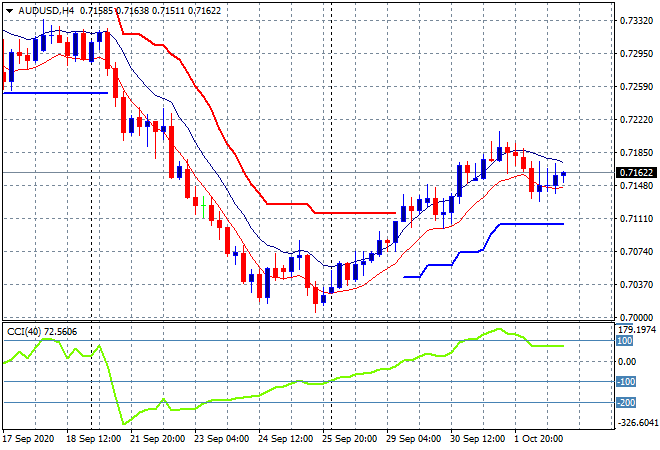
The Australian dollar followed the Euro trajectory with a fairly benign finish to the week although it did have a nice trading range on the TrumpVirus news that was then filled. The short term trend up towards the 72 handle is over, but may re-engage here if risk markets spike higher again on optimism – watch the high moving average at the 71.80 level for signs of a breakout:
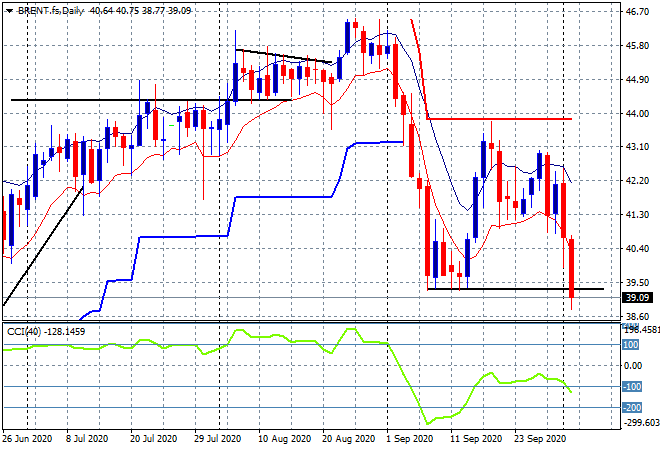
Oil futures were again smashed on sentiment Friday night with Brent falling another 4% lower to close just above the $39USD level. The daily chart shows this breakdown now complete as price tumbled below the early September lows, so watch for a follow through here this week:
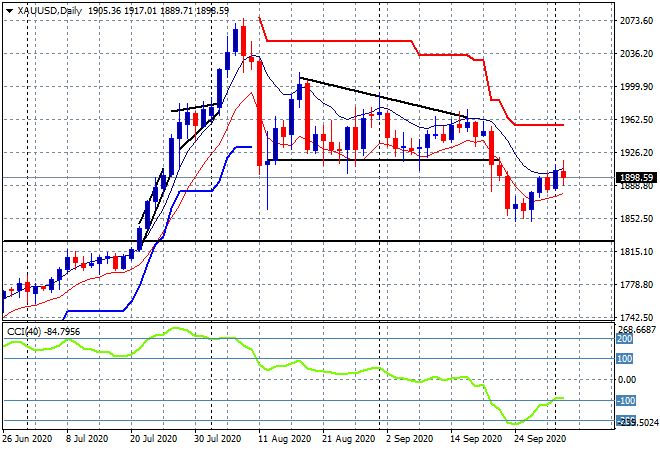
Gold got a nice boost on Friday as it broke above the $1900USD per ounce level but again this ran out of steam late in the session with the daily chart showing a close back below it what looks like a very weak uptrick. The obvious level to beat here to get back on track is the daily/weekly support level that eventually broke at the $1930USD per ounce level:
Glossary of Acronyms and Technical Analysis Terms:
ATR: Average True Range – measures the degree of price volatility averaged over a time period
ATR Support/Resistance: a ratcheting mechanism that follows price below/above a trend, that if breached shows above average volatility
CCI: Commodity Channel Index: a momentum reading that calculates current price away from the statistical mean or “typical” price to indicate overbought (far above the mean) or oversold (far below the mean)
Low/High Moving Average: rolling mean of prices in this case, the low and high for the day/hour which creates a band around the actual price movement
FOMC: Federal Open Market Committee, monthly meeting of Federal Reserve regarding monetary policy (setting interest rates)
BOJ/Abenomics: Bank of Japan, economic policy/direction enacted by PM Shinzo Abe
DOE: US Department of Energy
Uncle Point: or stop loss point, a level at which you’ve clearly been wrong on your position, so cry uncle and get out!