

Friday night saw a surge on Wall Street despite a very disappointing durable goods order print for August, with all eyes on another stimulus package from Congress. Commodity markets were barely changed with gold and silver still under pressure from a strong USD, while in currency world the same applied with Euro hitting a new weekly low while the Australian dollar stands on the edge of breaking down completely.
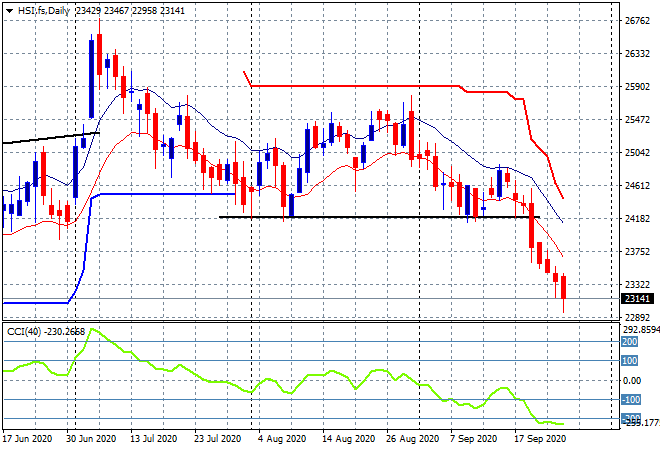
Looking at share markets in Asia from yesterday’s session where the Shanghai Composite was unable to finish with anything substantial, closing 0.1% lower to 3219 points while in Hong Kong the Hang Seng Index was off a little further, down 0.3% to 23235 points. This takes it well below the August lows at 24000 points as momentum remains substantially oversold with the 23000 level likely to come under pressure next:
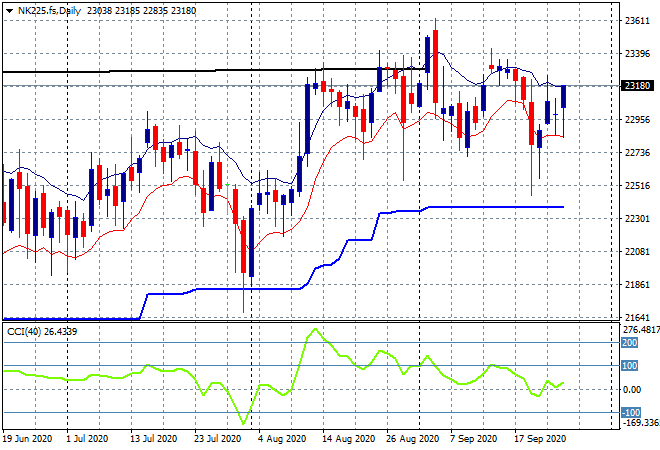
Japanese stock markets tried to clawback some lost confidence, with the Nikkei 225 closing 0.5% higher at 23204 despite a small drop in the USDJPY pair. The whipsaw pattern on the daily chart continues, and while resistance is still quite strong at the 23300 level support is building better again, with long tails of buying support below and price still well above trailing ATR daily support. The area to watch this week is the 23300 level for an upside breakout:
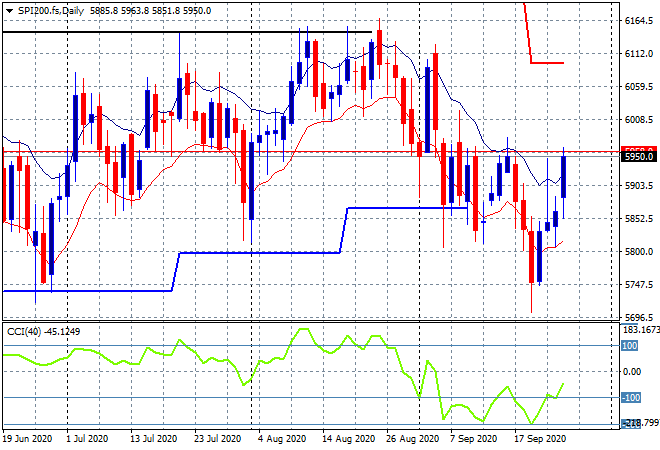
The ASX200 wins the gong again for the best in the region by surging 1.5% on the hopium, closing the week out at 5964 points. SPI futures are up about 20 points, so we could see a break above the 6000 point level and the start of a swing play back to the previous highs above 6100 points as bottom feeders pick out “bargains”:
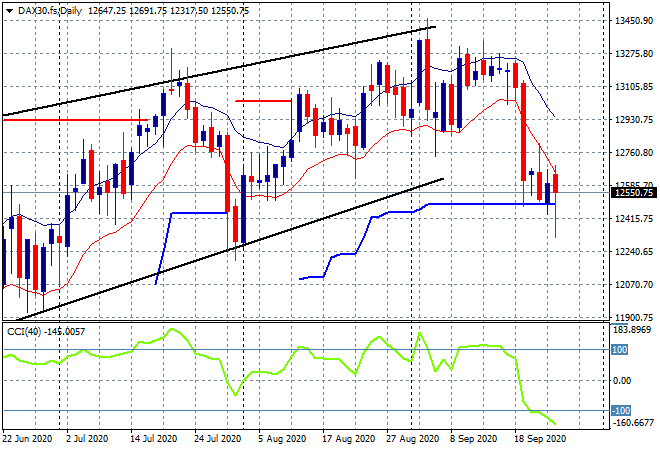
European markets sold off at first but were able again to fill in somewhat as Wall Street opened higher, with only the FTSE able to climb back to a positive result, the continent putting in losses, with German DAX closing 1% lower at 12469 points. Notably, futures clawed back about half of that loss, with price just on ATR daily support at the 12400 level which is still sending out an ominous signal as COVID cases continue to rise in Europe, with any break below confirming a breakdown:
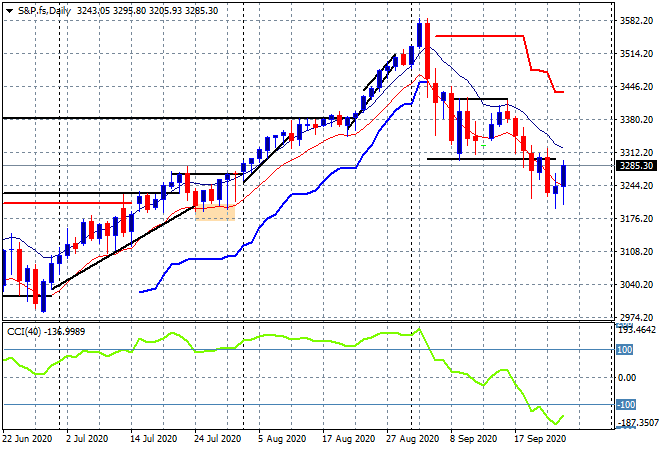
Wall Street’s rebound is holding on with the headline results again in the green on the back of another potential fiscal stimulus package from Congress. The Dow lifted over 1.3% while the S&P500 finished 1.6% higher to 3298 points, continuing its bouncing off the previous lows. The daily chart still shows a very weak position here with an inability to get back above prior support, current resistance at the key psychological 3300 point level:
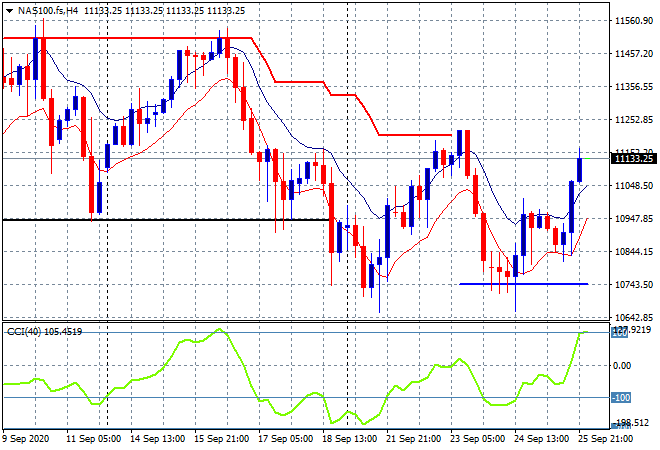
The NASDAQ gained more than 2%, with the four hourly chart showing a double bottom pattern firming, with a confirmation above the 11300 point level for another surge back up towards 11600:
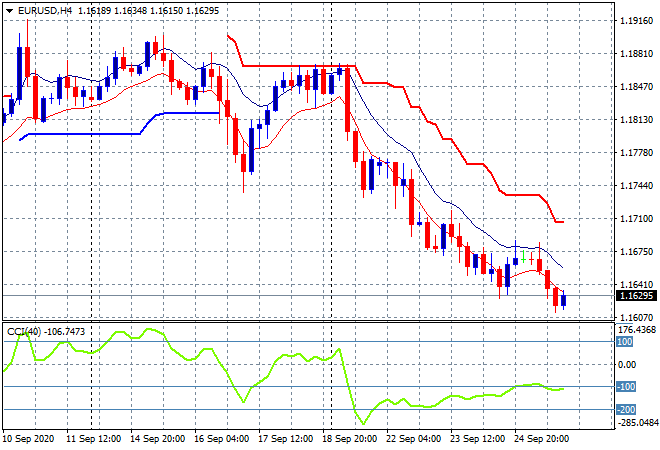
Currency markets continue to be weighed down by a strong USD and after a small reprieve in the previous session, Friday night saw the Euro put in another weekly low, almost breaking below the 1.16 level in the process. The medium term picture continues to firm downwards here as risk weighs the return of the second wave of the pandemic in the European sphere, with the slight chance of a long swing trade evaporating as both Euro and Pound Sterling are dumped in kind:
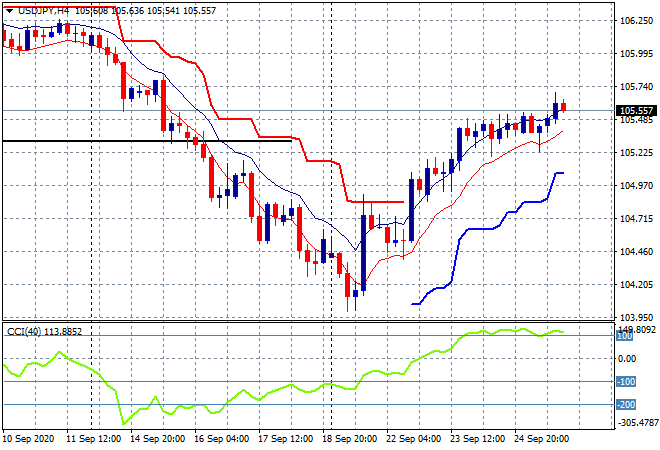
The USDJPY pair finished its own little pause with another advance, this time exceeding the former August lows (solid black horizontal line) after a small mid-week hesitation. Momentum remains slightly overbought and in a good position to tackle the 106 handle next:
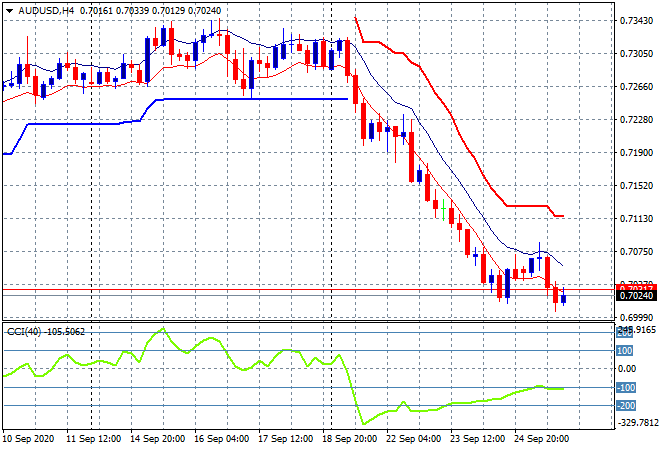
The Australian dollar is in an even dire predicament than Euro, as it flirted with the 70 level vs USD on Friday night, managing to finish the week with the lowest session ever, dropping 300 pips for the five trading days! While this is extremely oversold it still looks ominous for the Pacific Peso as price is rolling over on the weekly chart as well for the first time since the epic rebound from March – I expect a small rebound here before another leg down:
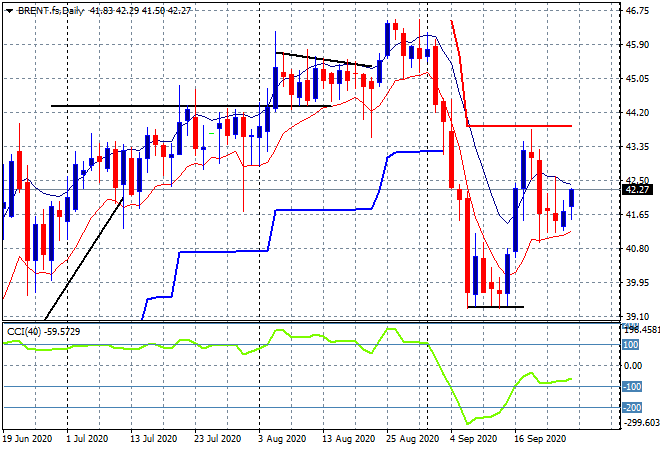
Oil futures remain in a holding pattern with no real movement overnight with Brent markers stuck just above the $42USD level. The daily chart still hasn’t shown a break above trailing ATR resistance yet so this has the potential to fizzle out here as daily momentum stays flat – watch the low moving average at the last two session lows at the $41 level for signs of a breakdown:
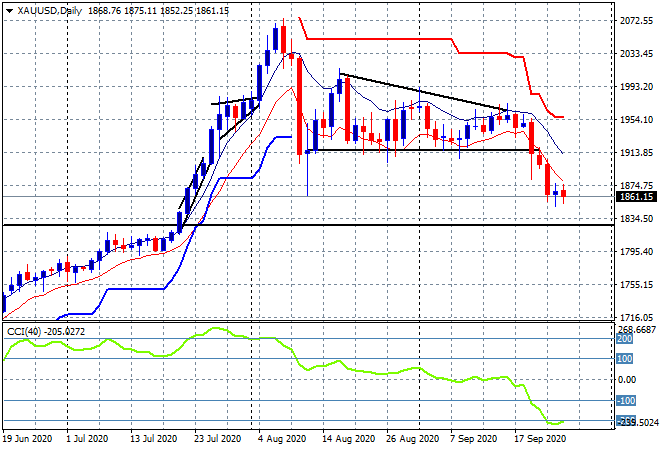
Gold and silver are moving in lockstep with other undollars, although Friday night saw another small leg down to match the previous breakdown low at the $1860USD per ounce level. The weekly and daily charts are still exhibiting a classic breakdown with the potential to get back to the previous secular bull market high just above the $1820USD per ounce level, although there is a small potential for a rebound due to the oversold status:
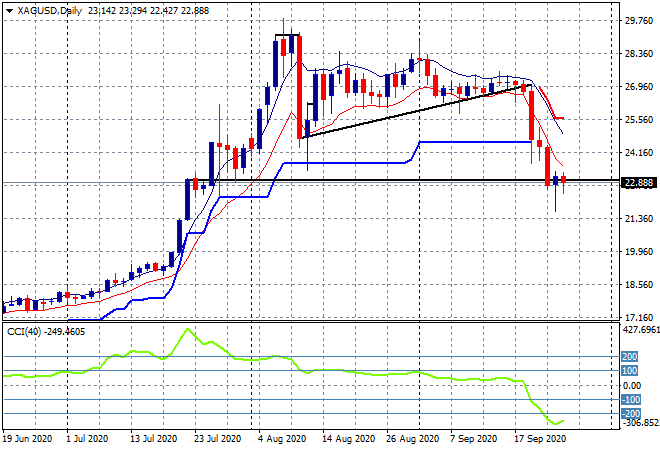
Silver has a similar chart pattern underway, although its teetering below the $23USD per ounce level that was the previous big breakout point:
Glossary of Acronyms and Technical Analysis Terms:
ATR: Average True Range – measures the degree of price volatility averaged over a time period
ATR Support/Resistance: a ratcheting mechanism that follows price below/above a trend, that if breached shows above average volatility
CCI: Commodity Channel Index: a momentum reading that calculates current price away from the statistical mean or “typical” price to indicate overbought (far above the mean) or oversold (far below the mean)
Low/High Moving Average: rolling mean of prices in this case, the low and high for the day/hour which creates a band around the actual price movement
FOMC: Federal Open Market Committee, monthly meeting of Federal Reserve regarding monetary policy (setting interest rates)
BOJ/Abenomics: Bank of Japan, economic policy/direction enacted by PM Shinzo Abe
DOE: US Department of Energy
Uncle Point: or stop loss point, a level at which you’ve clearly been wrong on your position, so cry uncle and get out!