

Hopium is wafting back into risk markets as the possibility of another fiscal stimulus package in the US got Wall Street off the hook as it teeters on terminal support. Asian and then European bourses were falling going into the late session, but the S&P500 managed to eke out a small gain while the economic data continues to paint a mixed pictures. US initial jobless claims rose again, while new home sales lifted higher than expected. The USD is mostly unchanged, although the Australian dollar remains on the ropes, while bond yields traded in a very tight range.
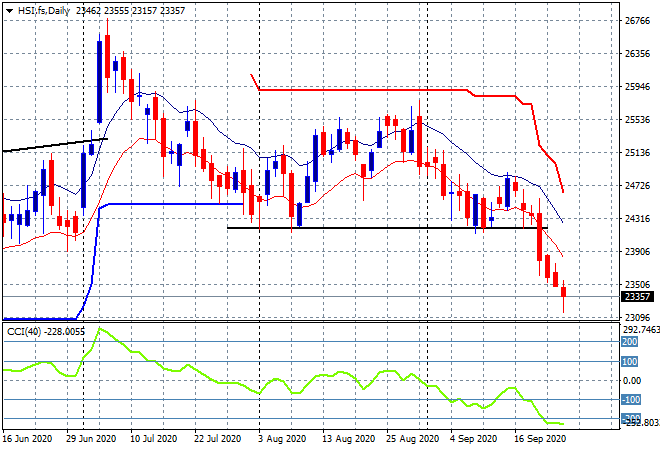
Looking at share markets in Asia from yesterday’s session where the the Shanghai Composite resumed its selloff, falling over 1.7% to 3223 points while in Hong Kong the Hang Seng Index fell further, losing 1.8% to 23311 points. This takes it well below the August lows at 24000 points as momentum remains substantially oversold. The 23000 level is likely to come under pressure next:
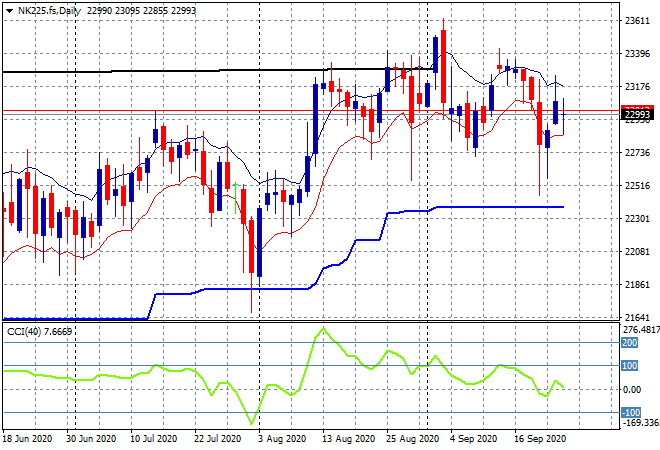
Japanese stock markets fell at about half the pace, the Nikkei 225 closing just over 1% lower to 23087 points despite a continued lift in the USDJPY pair. The whipsaw pattern on the daily chart continues, with resistance still quite strong at the 23300 level although support remains almost equally as firm. The long tails of buying support below and price still above trailing ATR daily support indicate this market is not yet broken, but watch that high moving average to act as short term resistance:
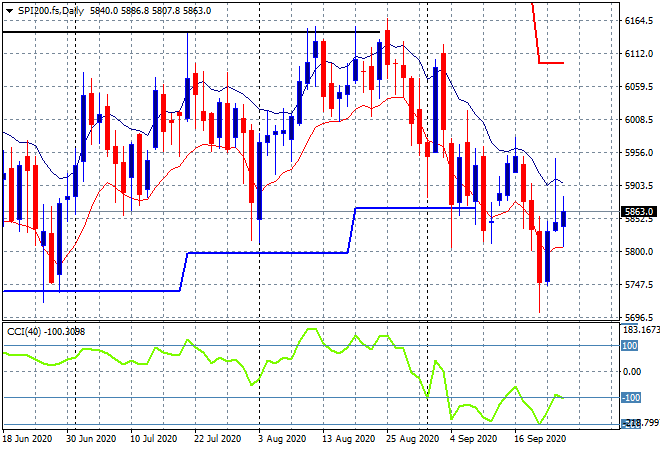
The ASX200 was the best in the region by falling the least, only down 0.8% to close at 5875 points. SPI futures are up a handful of points, so we could see a firming here around the 5900 point level going into the end of turgid trading week :
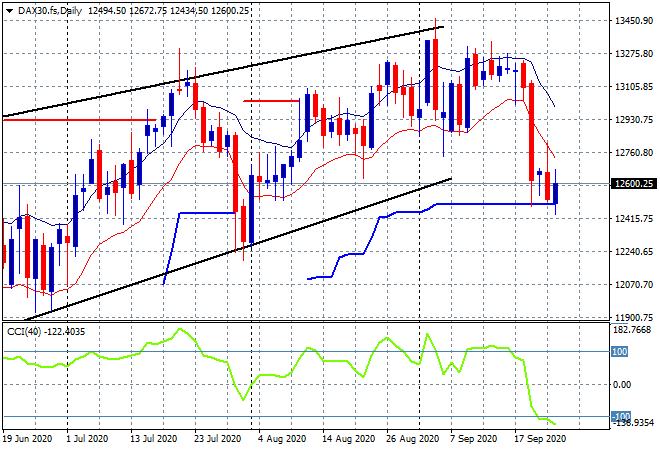
European markets sold off at first and then were able to fill in somewhat as Wall Street lifted, although the FTSE stumbled the most with a 1.3% fall, the German DAX managed to finish only 0.3% lower at 12606 points. Price remains poised here just above ATR daily support at the 12400 level which puts the leader of the pack in an ominous position going into the end of the trading week, with any break below confirming a breakdown:
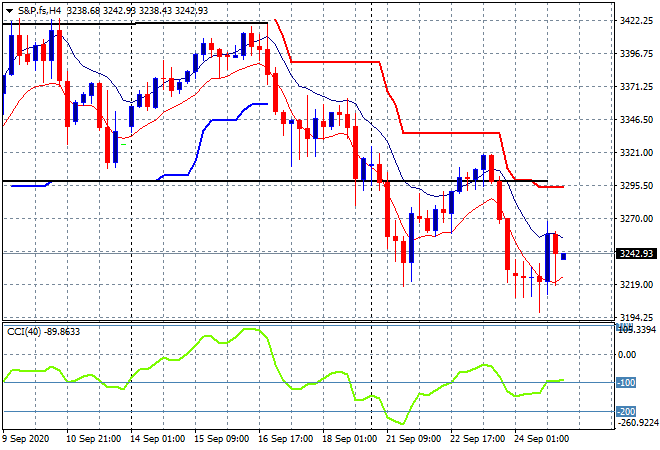
Wall Street’s rebound is just holding on with the headline results in the green, but not showing the full picture. The Dow gained a handful of points, while the S&P500 finished 0.3% higher to 3246 points, bouncing off the previous lows. The four hourly chart still shows a very weak position here with an inability to get back above prior support, current resistance at the key psychological 3300 point level:
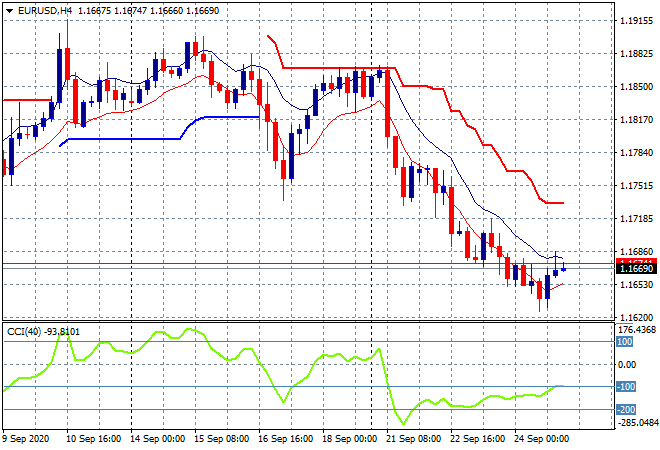
Currency markets continue to be weighed down by a strong USD but saw a slight reprieve overnight as the Euro managed to stave off another low but still remained well below the 1.17 handle. The medium term picture continues to firm downwards here as risk weighs the return of the second wave of the pandemic in the European sphere. There is a slight chance here of a long swing trade up towards but likely not above the 1.17 level:
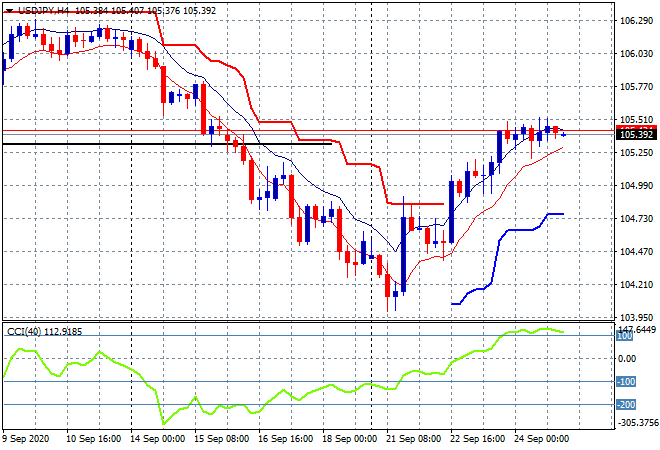
The USDJPY pair also had a pause, despite wanting to firm above the 105 handle as hesitation slowly builds on the four hourly chart. Price is stuck at the former August lows (solid black horizontal line) which I’ve been saying for awhile could provide substantial resistance, so watch for a potential rollover here shortly:
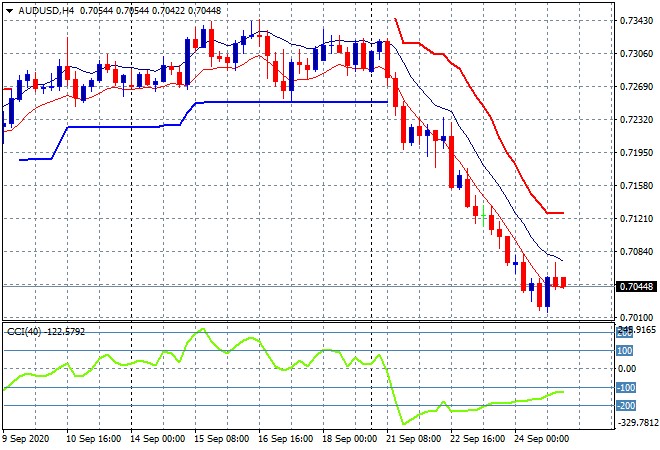
The Australian dollar remains in a similar predicament to Euro, but weaker still as it flirts with the 70 level vs USD. Price managed to put in another session low before rebounding slightly to the 70.40 level this morning. This still looks ominous for the Pacific Peso as price is rolling over on the weekly chart as well for the first time since the epic rebound from March:
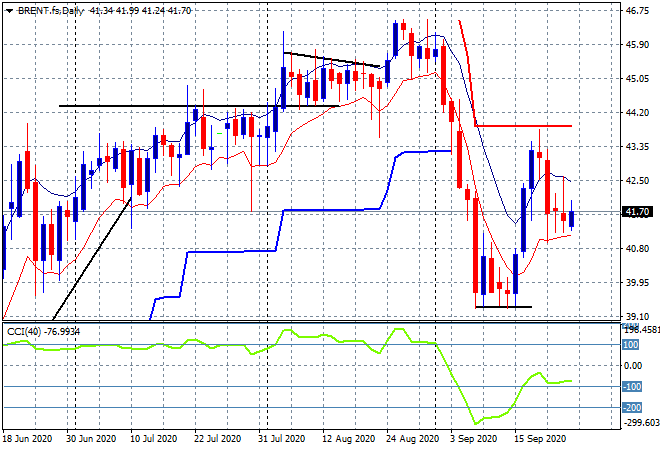
Oil futures remain in a holding pattern with no real movement overnight with Brent markers stuck just below the $42USD level. The daily chart still hasn’t shown a break above trailing ATR resistance yet so this has the potential to fizzle out here as daily momentum stays flat – watch the low moving average at the last two session lows at the $41 level for signs of a breakdown:
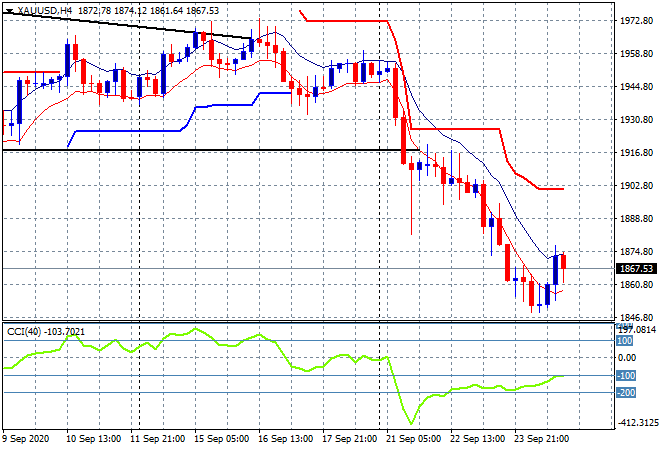
Gold and silver are moving in lockstep with other undollars, this time with a small reprieve seeing the former moving slightly high off the bottom to close at the $1867USD per ounce level overnight. The weekly and daily charts are still exhibiting a classic breakdown with the potential to get back to the previous secular bull market high just above the $1820USD per ounce level, although there is a small potential for a rebound due to the oversold status:
Glossary of Acronyms and Technical Analysis Terms:
ATR: Average True Range – measures the degree of price volatility averaged over a time period
ATR Support/Resistance: a ratcheting mechanism that follows price below/above a trend, that if breached shows above average volatility
CCI: Commodity Channel Index: a momentum reading that calculates current price away from the statistical mean or “typical” price to indicate overbought (far above the mean) or oversold (far below the mean)
Low/High Moving Average: rolling mean of prices in this case, the low and high for the day/hour which creates a band around the actual price movement
FOMC: Federal Open Market Committee, monthly meeting of Federal Reserve regarding monetary policy (setting interest rates)
BOJ/Abenomics: Bank of Japan, economic policy/direction enacted by PM Shinzo Abe
DOE: US Department of Energy
Uncle Point: or stop loss point, a level at which you’ve clearly been wrong on your position, so cry uncle and get out!