

Risk sentiment bounced back overnight following a stumbling start to the week with Wall Street leading the charge but the USD continued to firm against the majors and precious metals. The latest US existing home sales data surprised to the upside, while bond markets remained firm and largely unchanged.
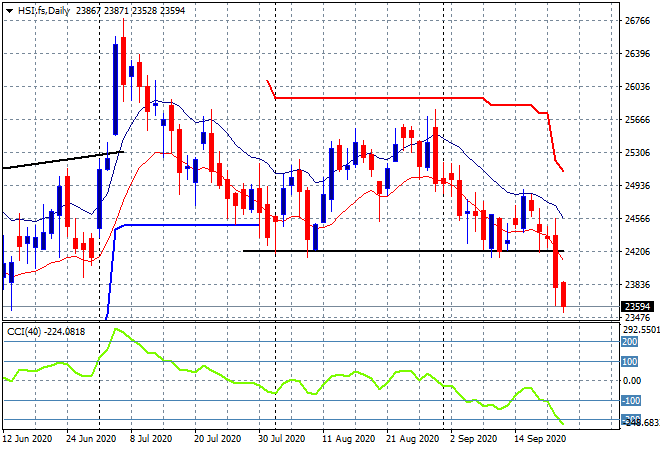
Looking at share markets in Asia from yesterday’s session where the Shanghai Composite sold off sharply again, down nearly 1.5% to 3274 points while in Hong Kong the Hang Seng Index was off by nearly 1% to 23716 points. The August lows at 24000 points remain broken here with momentum substantially oversold, and while there is a chance of a swing play up, I’d watch for the 23000 level to come under pressure next:
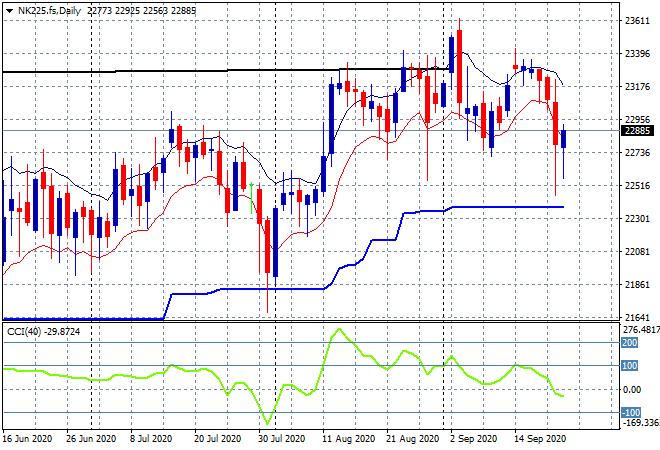
Japanese stock markets were closed for the Autumn equinox holiday (four day weekends sound nice). The daily futures chart of the Nikkei 225 is still showing a potential drop below the 23000 point level, but the long tails of buying support below and well above trailing ATR daily support still indicate this market is not yet broken:
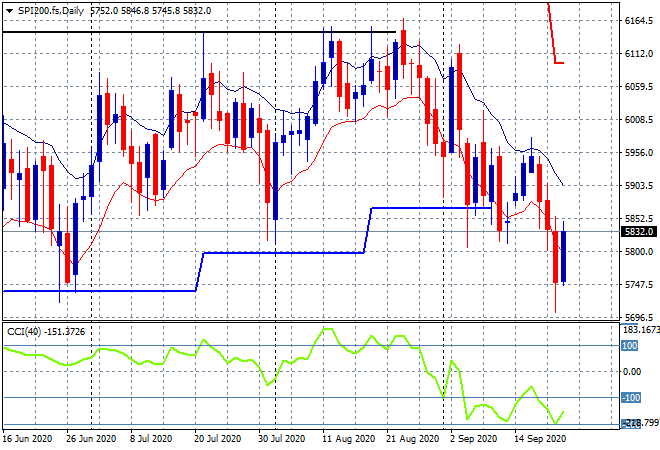
The ASX200 was the best in the region – only because it dropped the least – down 0.6% to 5784 points, now off by more than 14% for the year. SPI futures are up nearly 40 points as part of the general risk rebound so its likely the 5800 point barrier will be broken, but likely only temporarily as selling pressure remains stubborn:
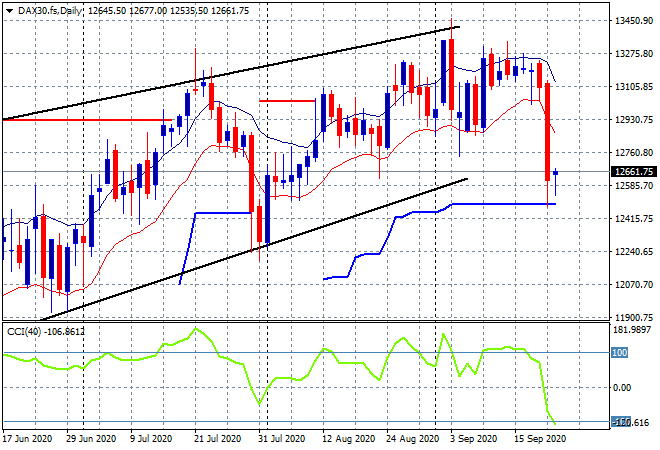
European markets rebounded sharply at first and then faded going into the Wall Street open, with peripheral bourses in Spain and France still falling while the German DAX managed to eke out a 0.4% lift to 12594 points. This keeps price just above ATR daily support at the 12400 level which must hold for the rest of the trading week, or the sellers will pile in:
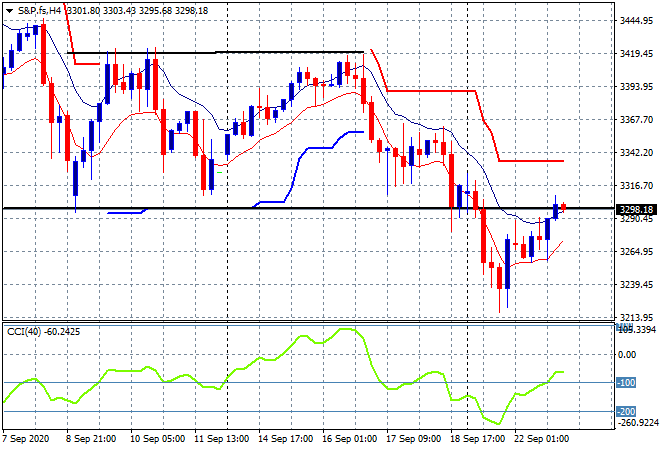
Wall Street loves a rebound for any reason and this one was just purely technical as oversold markets like to revert back to mean, with the S&P500 finishing 1% higher to 3315 points. The four hourly chart shows the clear bounce back up to but not substantially through key psychological 3300 point level where futures are wavering this morning. I still note is this a one off selloff with the BTFD crowd doing their job as usual or something more sinister:
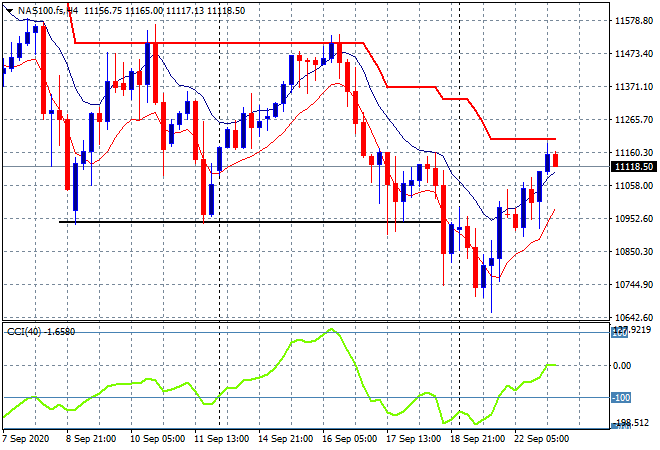
The four hourly NASDAQ chart shows how this bounceback has even more legs where it matters – the tech bubble ain’t burst yet! Price is about to break trailing ATR resistance, having bounced back above the previous weekly lows at the 11000 point level:
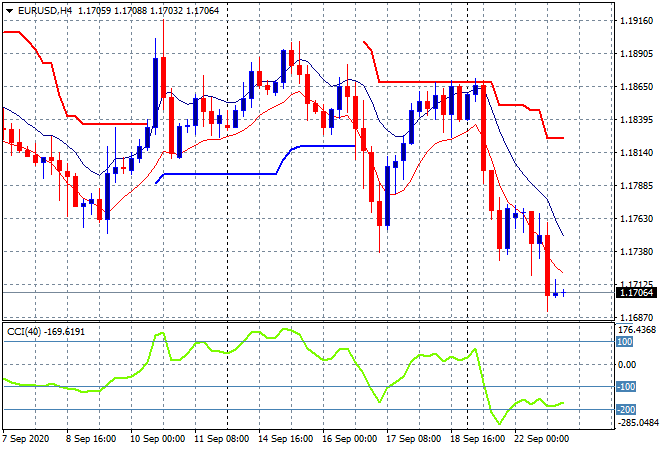
Currency markets continue to be weighed down by a strong USD with the Euro pushed to another low and breaking below the 1.17 handle before just climbing above this morning. The medium term picture is firming downwards here as risk weighs the return of COVID more in the European sphere (where governments are more likely to enact restrictions as opposed to “whatever who cares about another 200K dead” in the USA) This is not yet substantially oversold and we could see further drops tonight:
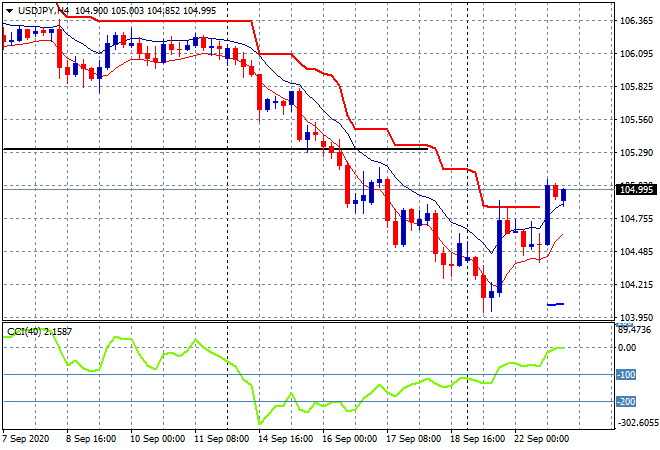
The USDJPY pair continued to firm alongside risk markets with a breach of the 105 handle and notably, the trailing resistance on the four hourly chart, almost confirming a new uptrend as this swing play gains legs. The next level to watch is the August lows (solid black horizontal line) which should still provide substantial resistance:
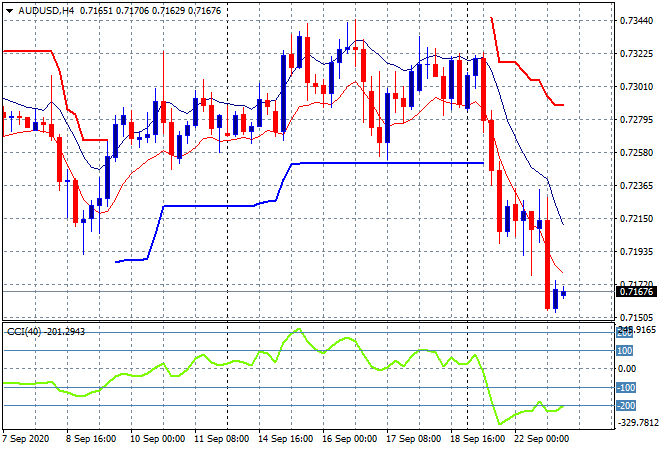
The Australian dollar remains in a similar predicament to Euro, despite the risk correlation, moving well below the 72 handle overnight and making another new weekly low. This is looking ominous for the Pacific Peso as price is starting to rollover on the weekly chart as well for the first time since the epic rebound from March:
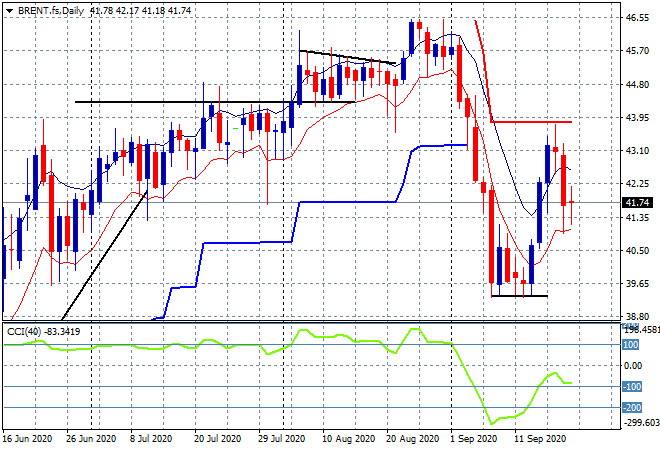
Oil futures remain in a holding pattern with a small retracement but no real new direction with Brent markers falling slightly to be still below the $42USD level. As I noted previously, the daily chart hasn’t shown a break above trailing ATR resistance yet so this has the potential to fizzle out here as daily momentum rolls over – watch the low moving average at the last two session lows at the $41 level for signs of a breakdown:
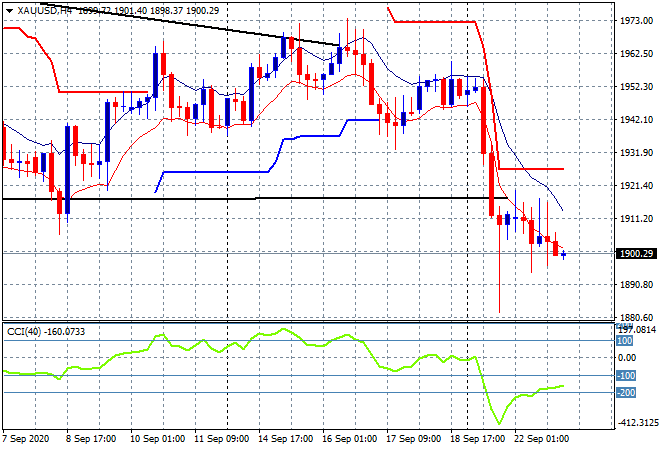
Gold and silver are still under substantial pressure with gold hovering just above the $1900USD per ounce level in a tight and almost unwilling downtrend. The daily chart still shows a classic breakdown, but the optimists should still watch for trailing ATR resistance at the $1925 level for a possible re-surgence:
Glossary of Acronyms and Technical Analysis Terms:
ATR: Average True Range – measures the degree of price volatility averaged over a time period
ATR Support/Resistance: a ratcheting mechanism that follows price below/above a trend, that if breached shows above average volatility
CCI: Commodity Channel Index: a momentum reading that calculates current price away from the statistical mean or “typical” price to indicate overbought (far above the mean) or oversold (far below the mean)
Low/High Moving Average: rolling mean of prices in this case, the low and high for the day/hour which creates a band around the actual price movement
FOMC: Federal Open Market Committee, monthly meeting of Federal Reserve regarding monetary policy (setting interest rates)
BOJ/Abenomics: Bank of Japan, economic policy/direction enacted by PM Shinzo Abe
DOE: US Department of Energy
Uncle Point: or stop loss point, a level at which you’ve clearly been wrong on your position, so cry uncle and get out!