

Another sea of red on overnight markets last night with Wall Street stumbling while other risk assets lifted higher. Bond yields lifted slightly while undollar assets like Aussie, Euro and oil prices gained although gold was the odd one out. US housing starts disappointed while the latest BOE meeting left all the settings unchanged, although they are starting to ponder negative interest rates as the Brexit disaster unfolds.
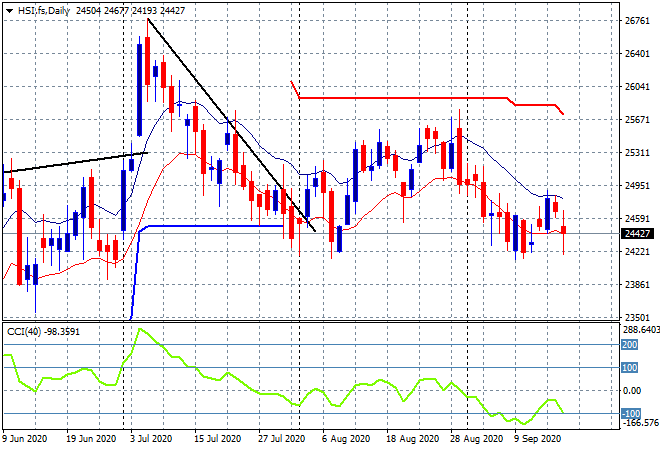
Looking at share markets in Asia from yesterday’s session where the Shanghai Composite was the relative best in the region, but still down 0.4% to 3270 points while in Hong Kong the Hang Seng Index was sharply off, down 1.5% to 24340 points. The August lows at 24000 points are now coming under fire as strong daily and weekly support hangs in the balance here with momentum still strongly negative:
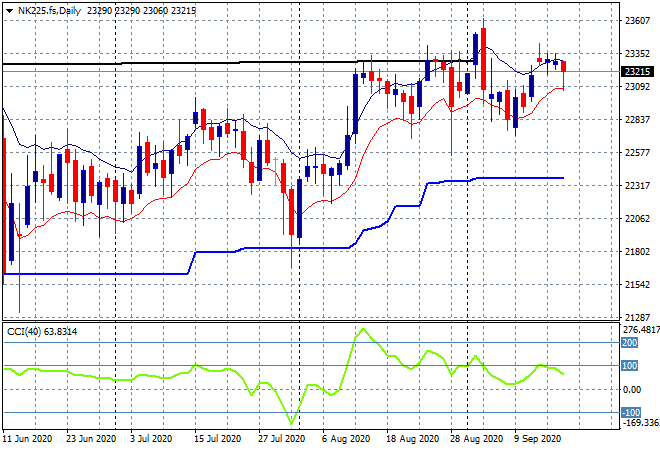
Japanese stock markets are no longer holding on as the stronger Yen bites as the Nikkei 225 closed 0.7% lower to 23319 points. Price had wanted to test resistance at the previous weekly highs as daily momentum keeps in the positive zone but the much stronger Yen remains a headwind, so watch for a potential break below the low moving average here:
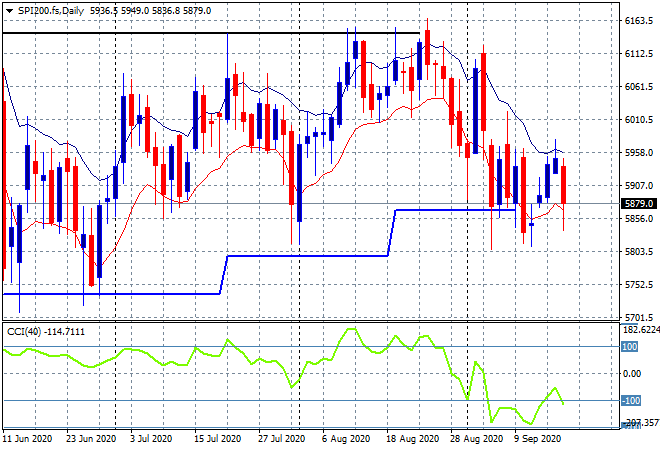
The ASX200 was nearly the worst, eventually closing 1.2% lower at 5883 points. SPI futures are suggesting little to no change but the ructions on Wall Street and the higher Australian dollar are surely going to test resolve going into the weekend. The inability to get above its own high daily moving average is telling here with a severe lack of confidence:
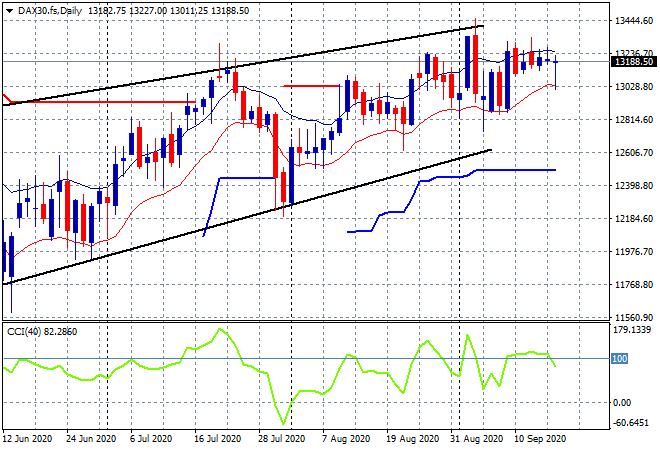
European markets sold off across the board, although the German DAX was the best, only falling 0.4% to 13208 points, taking back its previous gains. The daily chart is still not in a bearish mood compared to Asian bourses, with support at the 12900 point level, an intact uptrend channel but resistance at the recent daily/weekly highs near the 13300 point level is the key uncle point going forward:
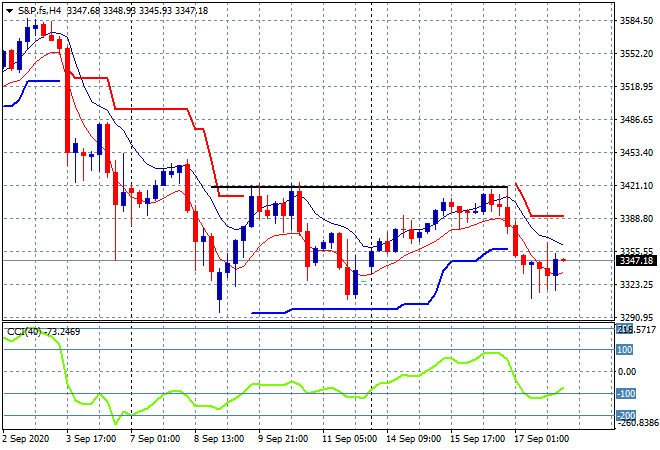
Wall Street however is really showing signs of capitulation here with the S&P500 closing nearly 0.9% lower to 3357 points. The four hourly chart is showing how very strong overhead resistance is at last week’s failed breakout position at the 3420 point level just can’t be beat with another push down to last weeks low. Anxious longs should take note that the session lows do not match and there is some buying support building:
The NASDAQ has an almost identical chart pattern but is not exhibiting as much buying strength compared to the S&P, although a swing play is setting up nicely here: 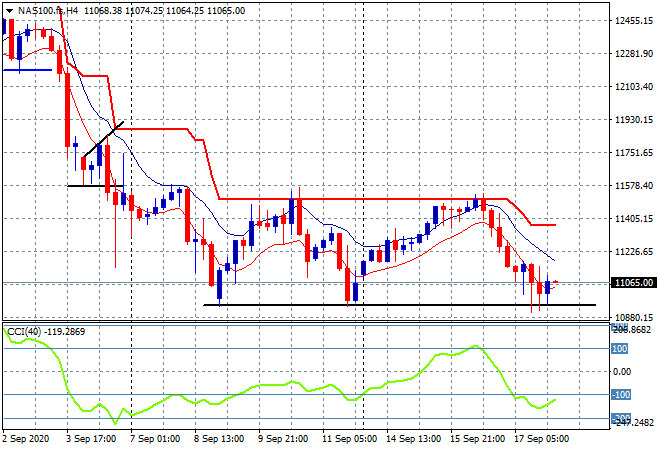
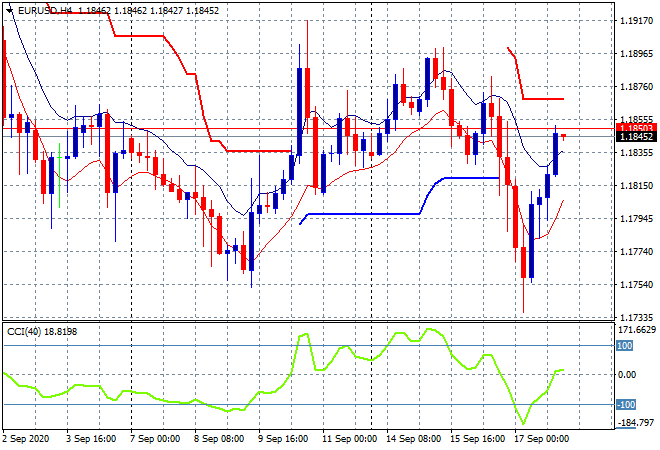
Currency markets remain mixed to say the least with some wide volatility ranges overnight as the Euro matched its previous weekly low in a big selloff and then moved nearly 100 pips higher to be back above the 1.18 handle again. This is all short term noise as the union currency continues its sideways dance, making it hard to discern real direction in the medium term:
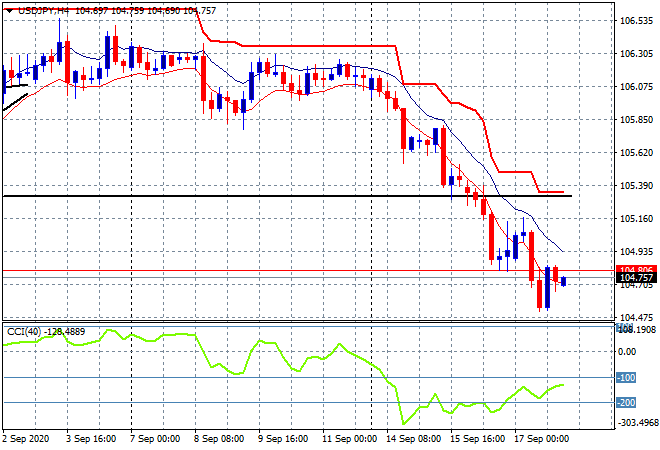
Yen buying continues however, with the USDJPY pair still in breakdown mode overnight, remaining well below the August lows (solid black horizontal line) and the 105 handle. I suggested a further selloff was possible but this oversold condition can’t last too much longer and we should see a swing back up to the high moving average soon:
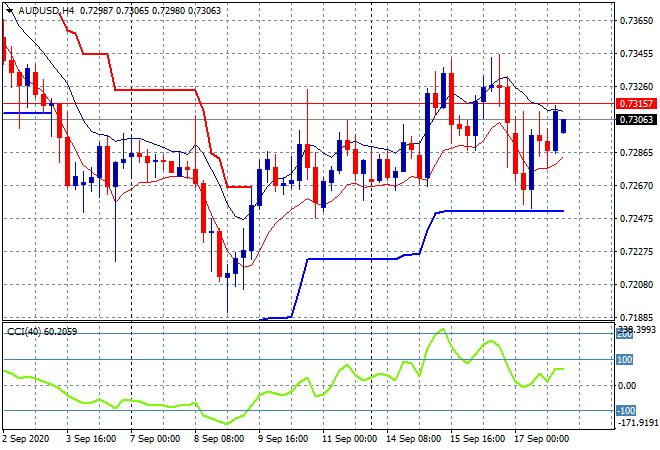
The Australian dollar was relatively calm despite the other undollar volatility with a small break below and then bounce off four hourly support to be almost back to the 73.40 level again. This still keeps it above last week’s price action so watch the low moving average at the 72.80 level to firm as support:
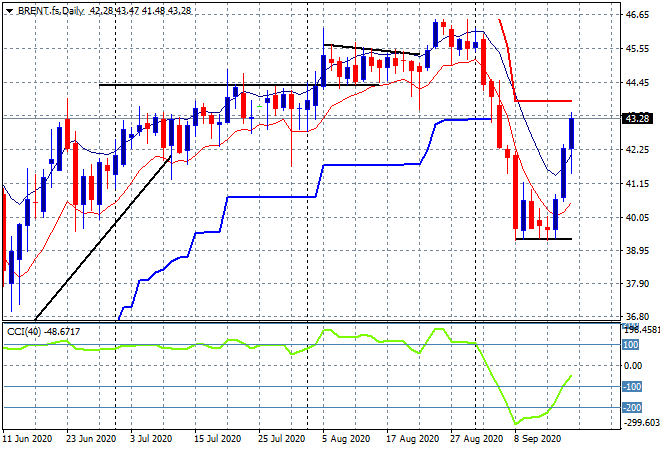
Oil futures continued their surge overnight on production problems, with Brent futures up nearly 3% to be above the $43USD level for another weekly high taken out. The significant break above trailing ATR resistance has turned the swing play off the support bottom at $39 into a new uptrend, although daily momentum is not yet positive:
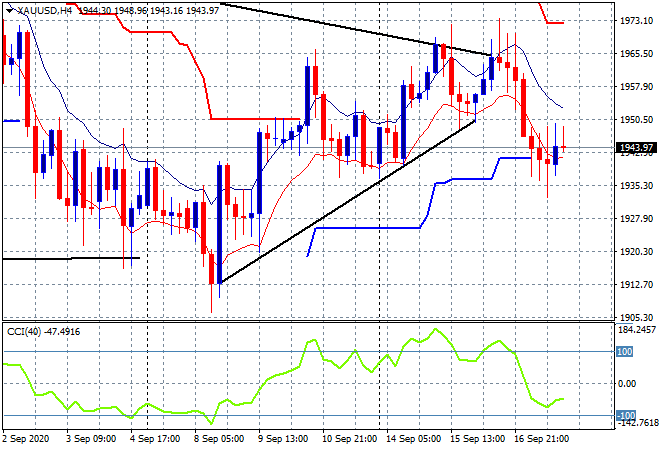
Gold however can’t gain traction and fell back overnight, having broken the symmetrical triangle pattern that had been developing on the daily chart to the downside, finishing just above the $1943USD per ounce level. I said this could turn into a swift selloff if support doesn’t hold at the $1950 level and here we are, but there is some buying support at the former anchor point nearer $1940 to watch carefully:
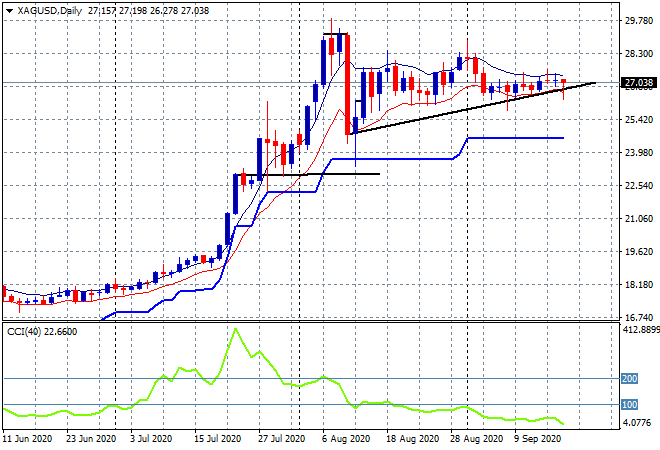
Silver is still the better precious metal play here with the daily chart still above the $27USD per ounce level, but momentum continues to lag and no new daily high is starting to bite on confidence. Significant resistance at the $28.30 level remains the level to beat :
Glossary of Acronyms and Technical Analysis Terms:
ATR: Average True Range – measures the degree of price volatility averaged over a time period
ATR Support/Resistance: a ratcheting mechanism that follows price below/above a trend, that if breached shows above average volatility
CCI: Commodity Channel Index: a momentum reading that calculates current price away from the statistical mean or “typical” price to indicate overbought (far above the mean) or oversold (far below the mean)
Low/High Moving Average: rolling mean of prices in this case, the low and high for the day/hour which creates a band around the actual price movement
FOMC: Federal Open Market Committee, monthly meeting of Federal Reserve regarding monetary policy (setting interest rates)
BOJ/Abenomics: Bank of Japan, economic policy/direction enacted by PM Shinzo Abe
DOE: US Department of Energy
Uncle Point: or stop loss point, a level at which you’ve clearly been wrong on your position, so cry uncle and get out!