

By Chris Becker
Wall Street should have stayed on holiday because it was a rough night, especially for those wanting to buy Tesla at the top, as it had its biggest one day drop ever, down 20% on various factors – probably including Robinhood traders going back to school…The NASDAQ has fallen a whopping 1.5% in the last month, or to be more precise, just over 11% down from its record high, 4% of this from last night alone. Stocks are looking wobbly all across the complex, with the FTSE the harbinger awhile back, but also Aussie stocks looking to break key support today even as the Australian dollar inverted. Oil prices cratered to a three month low, falling nearly 5% and the funny thing is, there’s been no economic catalyst for this sudden risk inversion…..
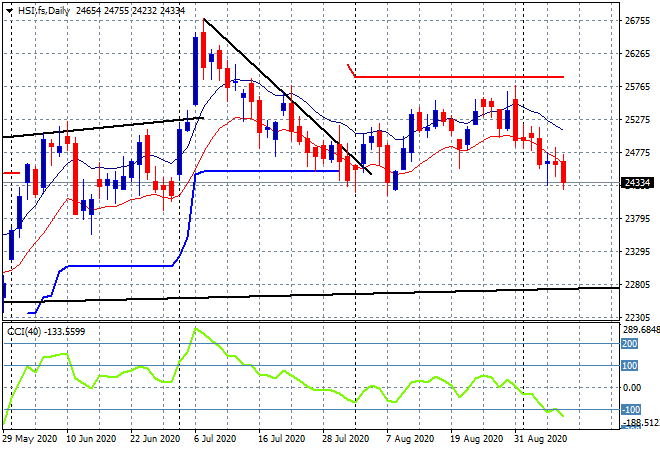
Looking at share markets in Asia from yesterday where in mainland China the Shanghai Composite closed nearly 0.7% higher at 3316 points while in Hong Kong the Hang Seng Index was looking to take back its previous losses but only managed a scratch session to finish at 24624 points. This dip is likely to turn into a wider breakdown as daily momentum goes sharply negative, so watch for the August lows at 24000 point proper to come under threat:
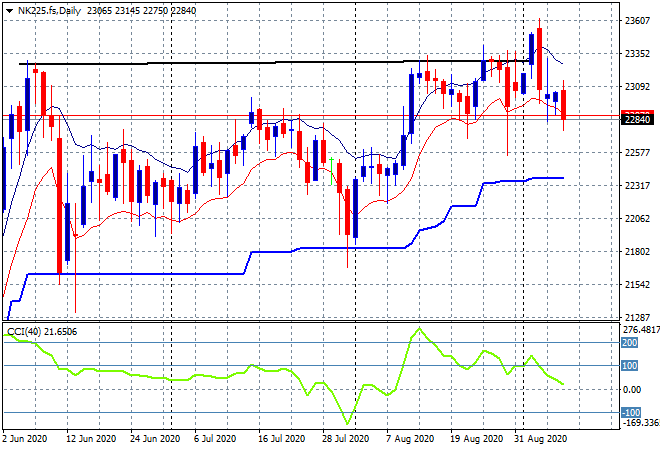
Japanese stock markets did even better, with the Nikkei 225 finishing 0.8% higher at 23274 points. Futures are obviously indicating an inversion now with the 23000 point support level likely ot be broken on the open this morning. Watch daily momentum to head negative with a downtrend as lows as ATR trailing support at 22300 points likely:
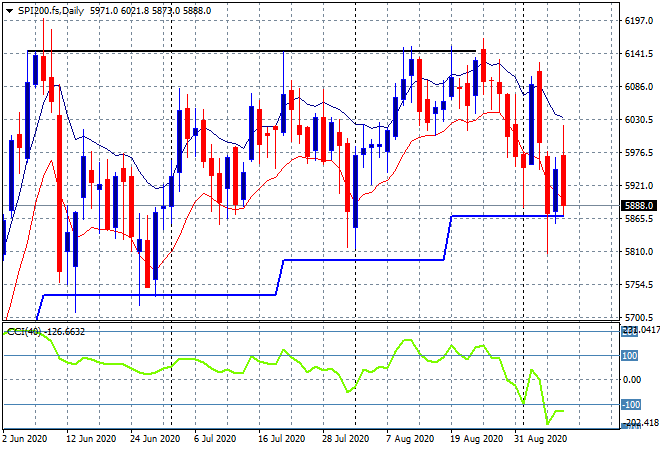
The ASX200 was the standout again, gaining more than 1% in anticipation of a solid open tonight on Wall Street, finishing at 6007 points. SPI futures however are down nearly 100 points or more than 1.5% this morning with a potential break of trailing daily support at the mid 5800 point level. I’ve been saying for a while that the key level to watch was always resistance at the 6000 point level and even a small peak above isn’t enough to get it from cracking lower:
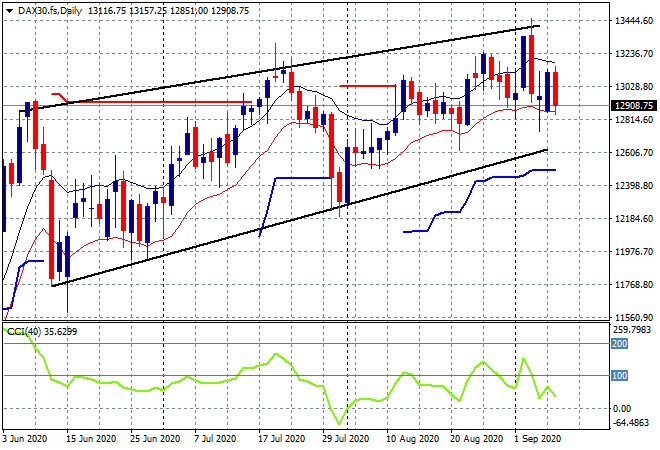
European markets were relatively calm last night with some mild pullbacks, with the German DAX finishing 1% lower to be back below the 13000 point level again, finishing at 12968 points before further falls in post close futures. The daily chart shows support at the 12900 point level remaining firm, with this uptrend channel still intact with daily momentum positive – but watch the low moving average carefully for signs of a rollover:
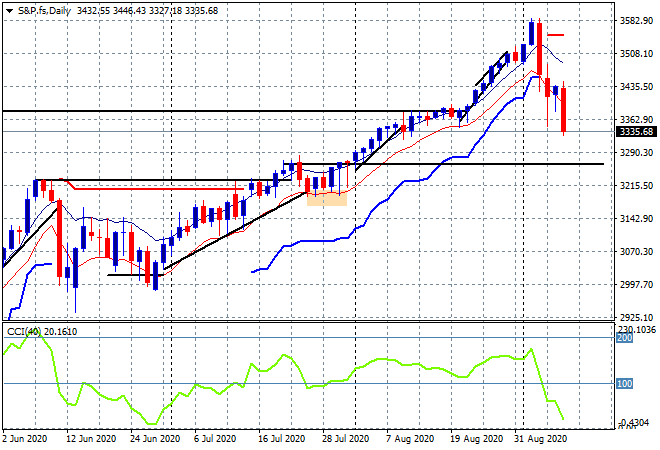
Wall Street came back with a vengeance with strong selloffs across the board, the Dow losing 2%, the NASDAQ more than 4% and even the S&P500 off by nearly 3% to 3331 points. In other words, taking the market back to the July highs, and still up 12% on the year. This has been in the cards for awhile but has not yet turned into a correction, just a mild dip. Correction territory requires negative daily momentum which hasn’t happened since the bottom in March:
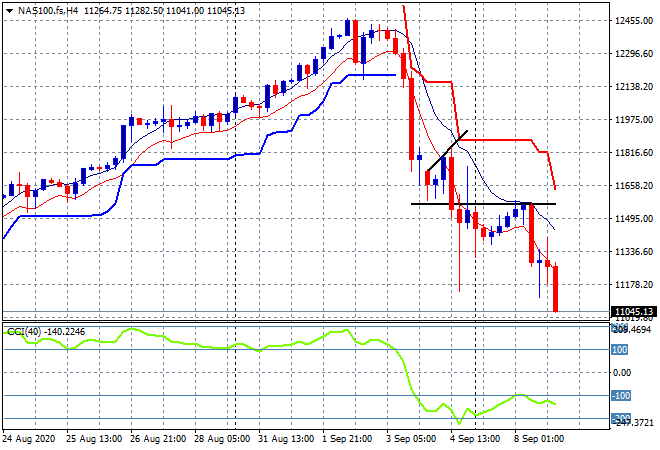
The four hourly chart of the NASDAQ showed that Friday nights resistance at the 11570 level (solid black horizntal line) needed to be breached to get the algos back in on the long side, but it didn’t happen – more to follow?
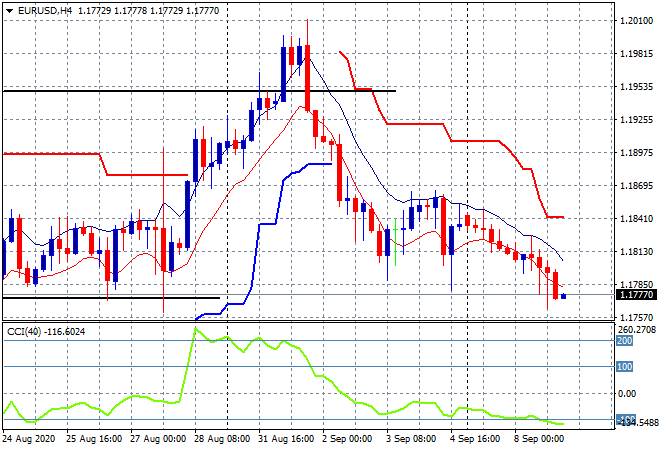
Currency markets were relatively calm with USD still firming against most of the majors, particularly Pound Sterling which is starting to nosedive in the wake of some pretty embattled Brexit negotiations, down to a new monthly low below the 1.30 handle. Euro also deflated, heading below the 1.18 handle proper with the four hourly chart showing a test of the previous weekly lows at the 1.1770 level:
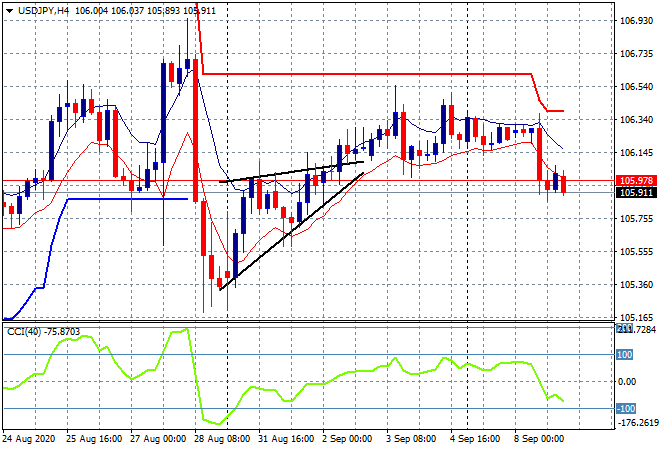
The USDJPY pair however dropped sharply and stayed down below the 106 level where the price pattern has quickly turned bearish. I was positioning for a potential breakout above the recent session highs but that was wrong, with a potential follow through below the 105.90 level the area to watch today:
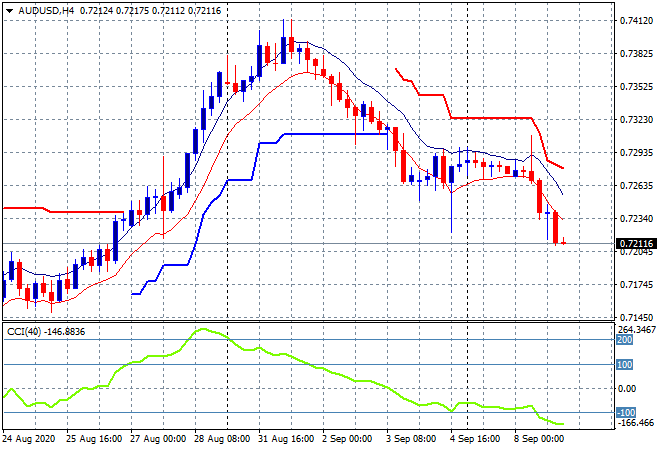
The Australian dollar had a fake breakout to deal with on the London open that then turned sour as the risk complex sold everything in sight. Price fell sharply thereafter, down to the 72 handle where it could break further today:
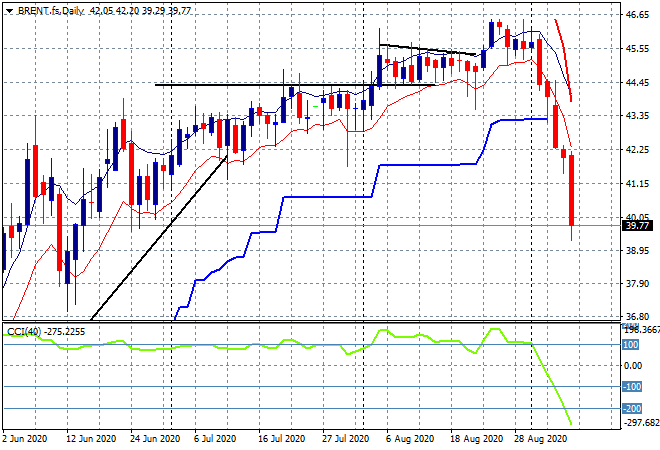
Brent futures are now in freefall with a 5% drop to another new monthly low, finishing below the $40USD level in an unsurprising and highly profitable short move! The follow through of longs caving in has fully happened here but could swing violently back, so watch the lower timeframes for signs of a swing play:
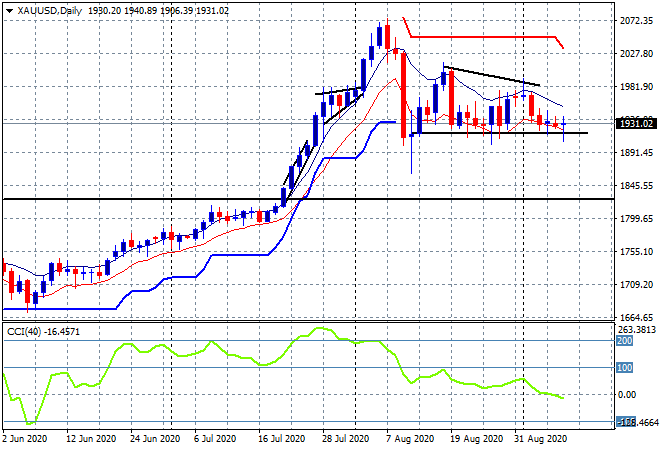
Gold remained dead flat again, finishing just above weekly support at the $1930USD per ounce level. Price remains technically oversold on four hourly momentum but price is holding on here for now although it could sharply fall back to the monthly support level at $1910 or below 1900 very quickly.
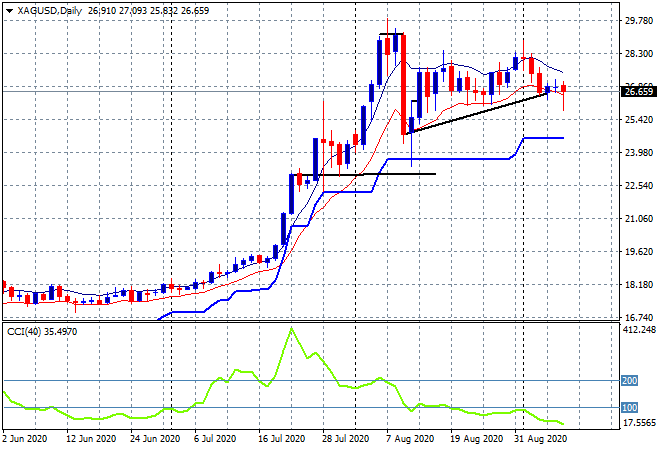
Silver also remains poised the daily chart stilling showing a deflationary mood setting in on buyers, with a false break and look see towards the $25USD per ounce level filled overnight. There is significant resistance to overcome at the $28.30 level:
Glossary of Acronyms and Technical Analysis Terms:
ATR: Average True Range – measures the degree of price volatility averaged over a time period
ATR Support/Resistance: a ratcheting mechanism that follows price below/above a trend, that if breached shows above average volatility
CCI: Commodity Channel Index: a momentum reading that calculates current price away from the statistical mean or “typical” price to indicate overbought (far above the mean) or oversold (far below the mean)
Low/High Moving Average: rolling mean of prices in this case, the low and high for the day/hour which creates a band around the actual price movement
FOMC: Federal Open Market Committee, monthly meeting of Federal Reserve regarding monetary policy (setting interest rates)
BOJ/Abenomics: Bank of Japan, economic policy/direction enacted by PM Shinzo Abe
DOE: US Department of Energy
Uncle Point: or stop loss point, a level at which you’ve clearly been wrong on your position, so cry uncle and get out!