

By Chris Becker
A big rise in US employment figures and a subsequent drop in the headline unemployment rate was not enough for stock markets to get through their “wibble” moments, with the NASDAQ leading the way with another fall, and European bourses in lockstep. Oil dropped to a new one month low although copper gained nearly 3% on the back of the solid German factory orders print. Asian markets look set to have a wobbly start to the trading week with sentiment still broadly mixed.
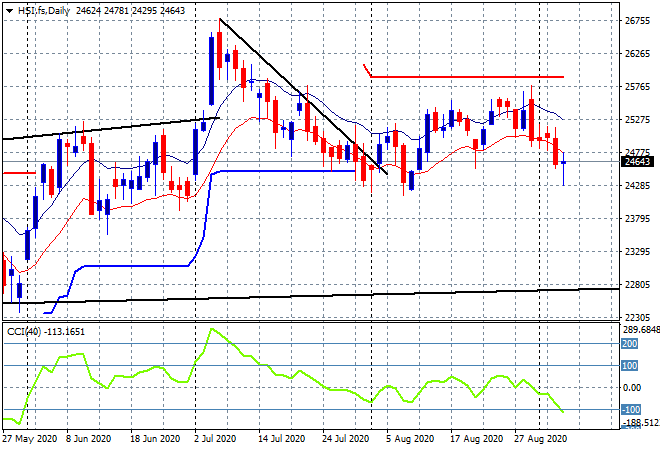
Looking at share markets in Asia from Friday where in mainland China the Shanghai Composite was down nearly 1% to close at 3355 points while in Hong Kong the Hang Seng Index was off 1.3% to be at 24695 points. This small dip could turn into a wider breakdown as price heads well below the low moving average and daily momentum goes sharply negative:
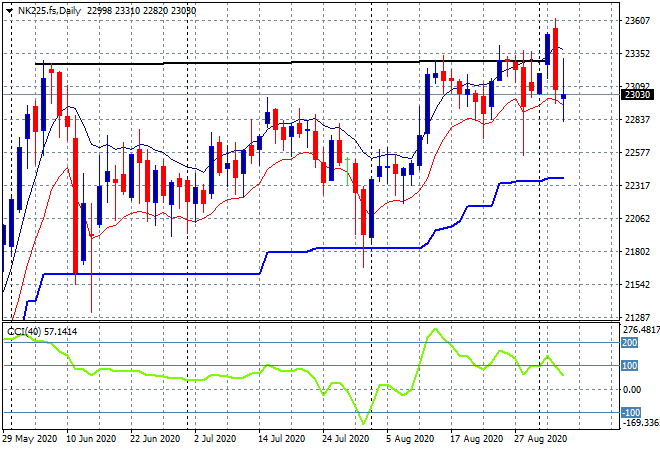
Japanese stock markets did about the same with the Nikkei 225 taking back its previous gains to finish 1.1% lower at 23205 points. Futures are very staid at the moment, indicating a possible reversion back to the 23000 point level but note than in the main, no new daily lows with the low moving average remaining flat:
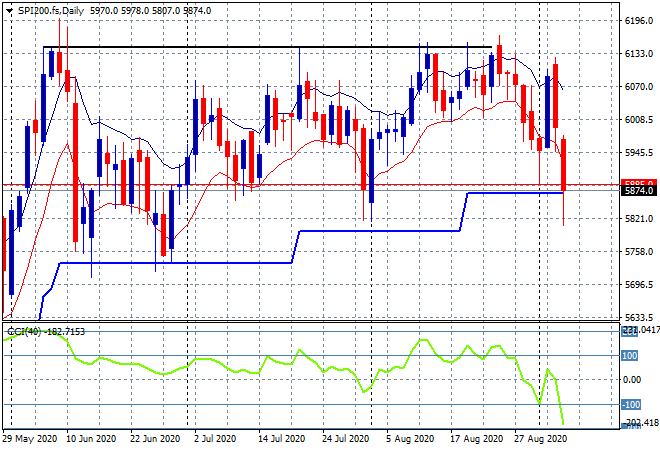
The ASX200 was the biggest loser however, falling some 3% to close the week out at 5925 points while the Australian dollar goes nowhere. The question is can the market recover from this shock , with SPI futures suggesting “only” a 40 point drop on the open. We could see an inversion of resistance and support here with the 6000 point level a proper barrier that must be broken soon or as the daily chart below shows, its not far from cracking lower:
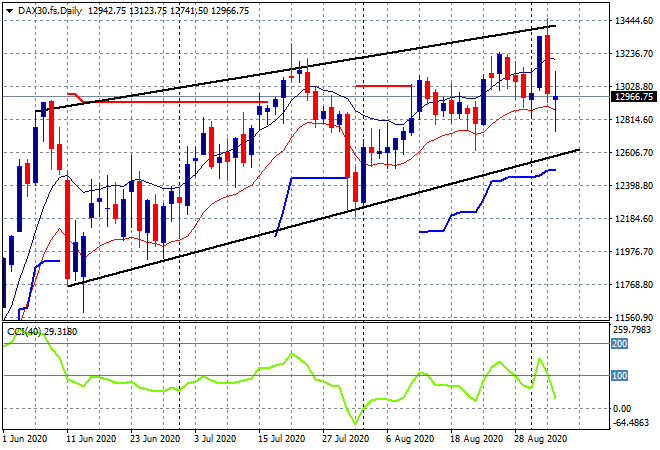
European markets were unable to escape the selloff with 1% plus losses across the continent with the German DAX finishing some 1.6% lower, breaking the 13000 point level decisively to close at 12852 points. Post close futures suggested a small fill of this as the Wall Street losses moderated later in the session. The daily futures chart shows support at the 12900 point level that must continue to hold, with daily momentum still firm:
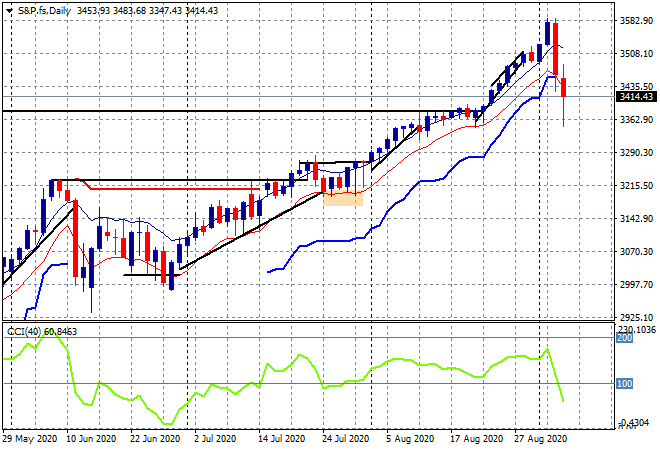
Wall Street had a relatively calm night amidst the NFP noise and post the one-day selloff with the S&P500 only falling 0.8% to close the week out at 3426 points, or basically back to its previous breakout level (upper solid black horizontal line). As I said on Friday, this move is relatively speaking not that bad considering the previous upside, but this could upset many amateurs here as the algos step in and sell quickly:
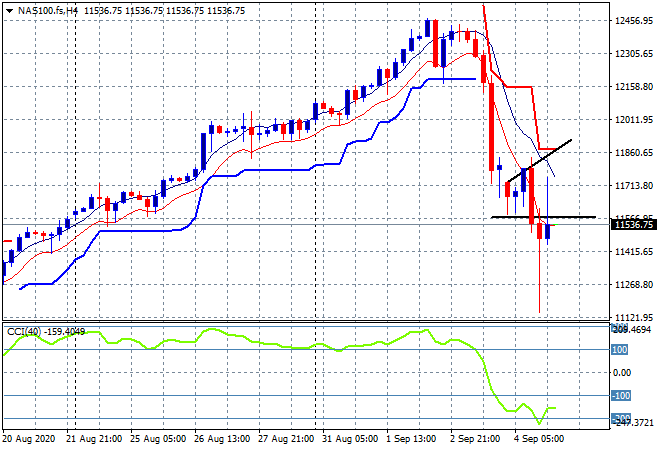
Here’s my four hourly chart of the NASDAQ canary from Friday night with a nice one-off profit below indicative support at the 11560 point level, but this was filled very quickly. The other gradient was my other potential position, and maybe the longs will be filled later tonight as the BTFD crowd steps in:
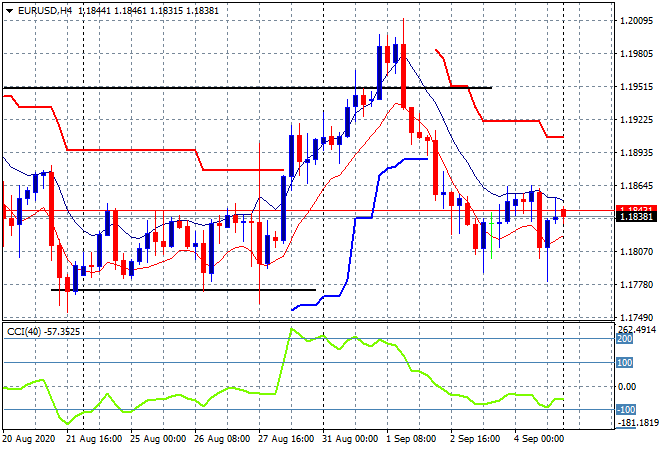
Currency markets were not as volatile as expected given the NFP and German factory orders prints with the USD basically unchanged for the 24 hours. The Euro had a small blip below the 1.18 handle but came back to square up remaining in a bearish sideways position going into this trading week with negative momentum on the four hourly chart unable to be beaten:
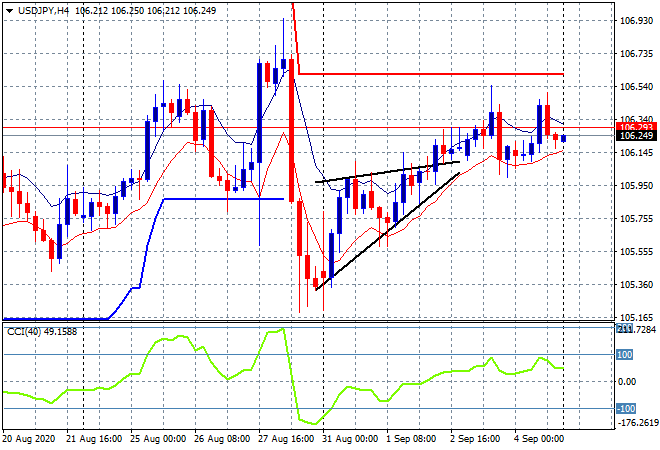
The USDJPY pair also flittered around the economic prints but eventually settled where it started the day at just above the 106 level where the price pattern is now morphing into a continuation instead of a short term top that I thought was forming here. The lack of buyers above the 106.30 level remains telling as is where I’m positioning for a potential breakout:
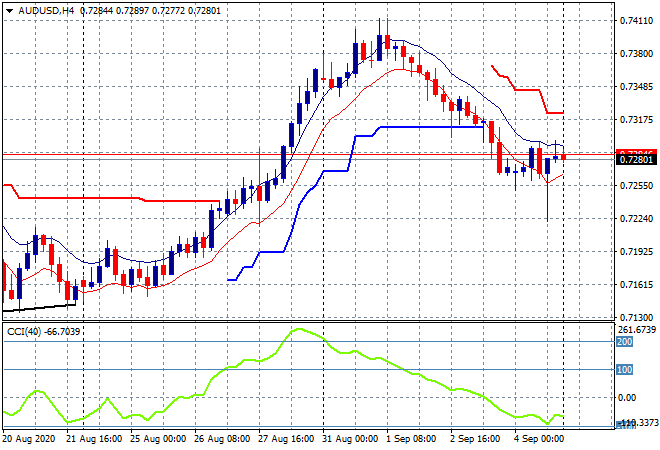
The Australian dollar looks like finishing its deflation and despite a one off round trip to the 72 handle and back on the NFP print, managed to close the week out just below the 73 level, staving off the next stage of a decline. This is not yet oversold and could continue lower but watch the previous breakout level from previous week at the 72.50 level as potential support firms:
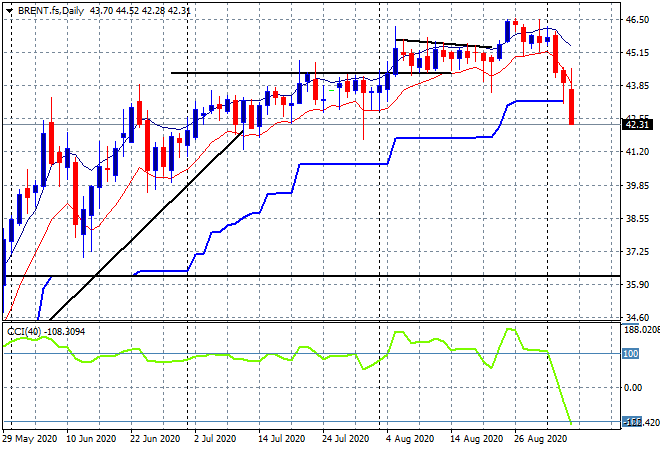
Brent futures continued to fall with another 3% drop on Friday night to a new monthly low, heading back below the $43USD level, and breaking trailing daily support as well. The daily chart had shown a clear bearish engulfing candle previously that setup these falls as the market had been struggling to get moving for quite sometime now. Watch for a follow through below these levels as ATR support was likely the uncle point for a swathe of long positions:
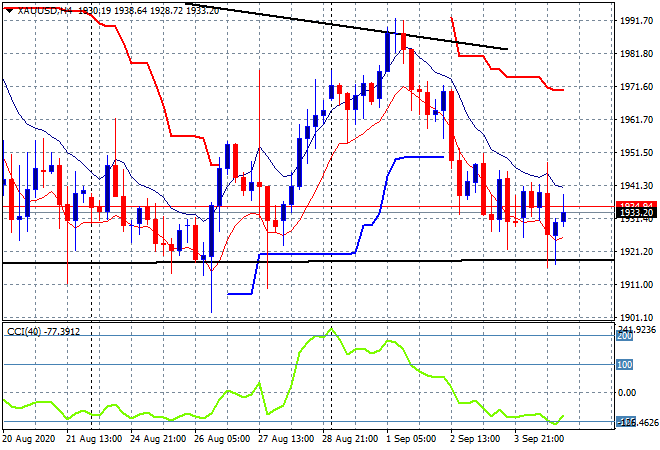
Gold continued to deflate but only in a minor fashion, finishing nearer weekly support at just above the $1930USD per ounce level. Price is now technically oversold on four hourly momentum but what is key this week is holding on above weekly support or it will sharply fall back to the monthly support level at $1910 or below 1900 very quickly.
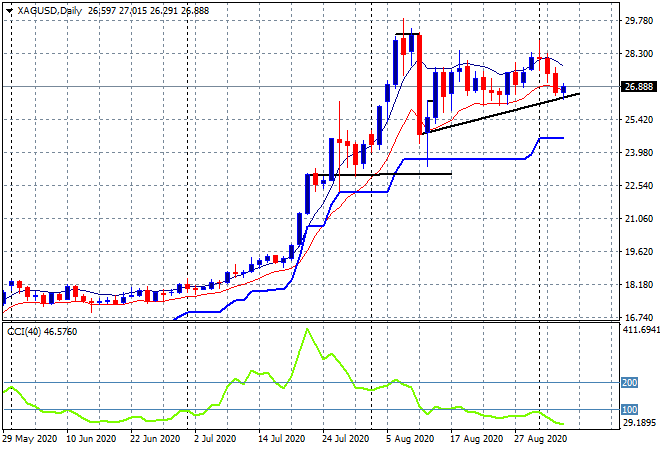
Silver also remains poised with an ascending triangle pattern on the daily chart starting to wane and be tested here at the upper trend line below the $27USD per ounce level. There is significant resistance to overcome at the $28.30 level:
Glossary of Acronyms and Technical Analysis Terms:
ATR: Average True Range – measures the degree of price volatility averaged over a time period
ATR Support/Resistance: a ratcheting mechanism that follows price below/above a trend, that if breached shows above average volatility
CCI: Commodity Channel Index: a momentum reading that calculates current price away from the statistical mean or “typical” price to indicate overbought (far above the mean) or oversold (far below the mean)
Low/High Moving Average: rolling mean of prices in this case, the low and high for the day/hour which creates a band around the actual price movement
FOMC: Federal Open Market Committee, monthly meeting of Federal Reserve regarding monetary policy (setting interest rates)
BOJ/Abenomics: Bank of Japan, economic policy/direction enacted by PM Shinzo Abe
DOE: US Department of Energy
Uncle Point: or stop loss point, a level at which you’ve clearly been wrong on your position, so cry uncle and get out!