

By Chris Becker
Stock markets had a “wibble” moment overnight with the NASDAQ dropping 5% as the major bubble, I mean tech stocks dragged everything back, but nowhere near to reality yet. This move was based entirely on sentiment with economic reports not coming in at any surprising levels, with the ISM non manufacturing print still strong, while initial jobless claims even slowed down. The USD was effectively unchanged but the Australian dollar fell sharply on the risk-off mood.
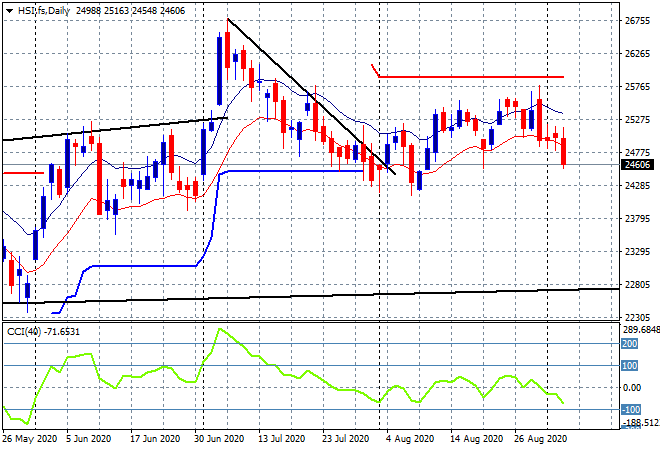
Looking at share markets in Asia from yesterday where in mainland China the Shanghai Composite sold off sharply at the close to finish down 0.6% to be well below 3400 points while in Hong Kong the Hang Seng Index was off by the same amount, closing at 25007 points. The potential breakdown I’ve been warning about is likely today as futures indicate a big drop below the low moving average as daily momentum goes sharply negative:
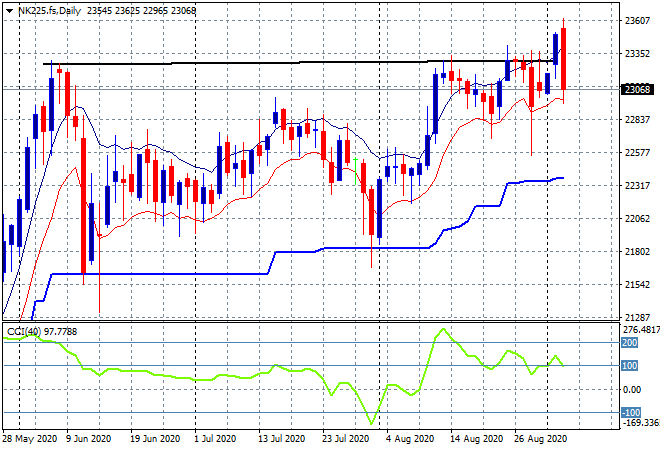
Japanese stock markets however did much better with the Nikkei 225 closing nearly 1% higher to 23465 with a continued breakout above the May highs. Futures however are indicating this maybe a one-off false move with a big drop expected down to the 23000 point level or even lower – watch the low moving average:
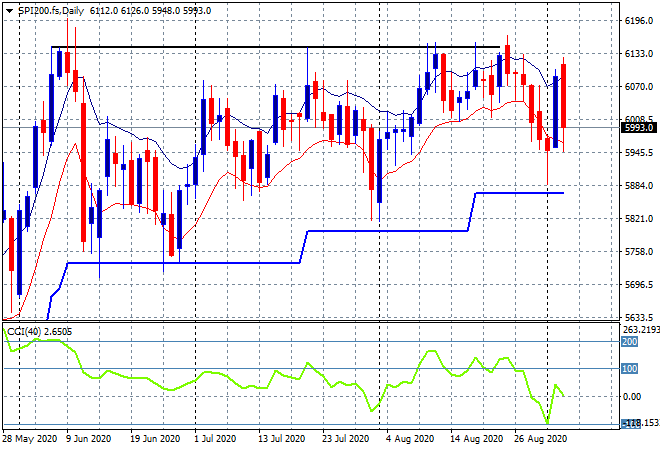
The ASX200 also surging higher again, up 0.8% going to closed at 6112 points as the Australian dollar continued to deflate. SPI futures are saying at least a 100 point drop on the open in response to the wibble on Wall Street, so watch for the 6000 point barrier that must hold as the new support level:
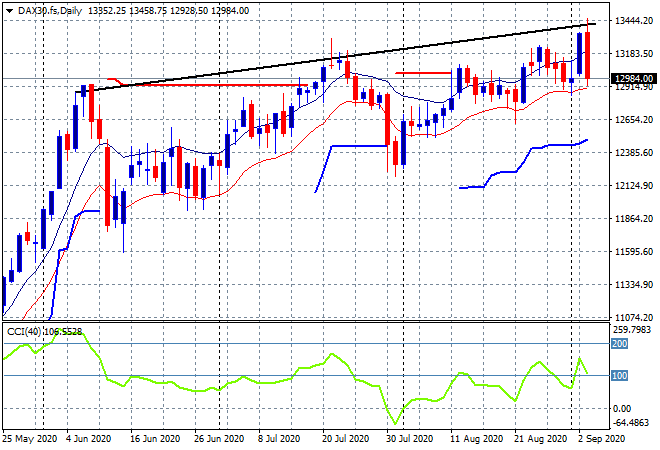
European markets were looking to advance on their recent move higher but were flummoxed as risk went suddenly off with the German DAX finishing some 1.4% lower, almost breaking the 13000 point level again to close at 13057 points. Post close futures alongside the afternoon Wall Street session show a further retracement with the daily futures chart showing support at the 12900 point level that must hold tonight before a rout takes place:
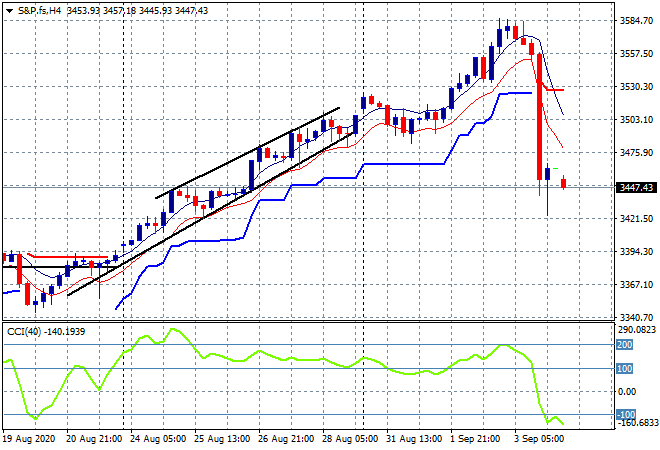
Wall Street wobbles are fun because they are almost literally out of the blue or red depending on your point of view. The S&P500 fell down over 100 points to finish 3.5% lower to 3455 points, or basically last weeks level. Relatively speaking its not a big move given the previous upside, but this could upset many amateurs here as the algos step in and sell quickly:
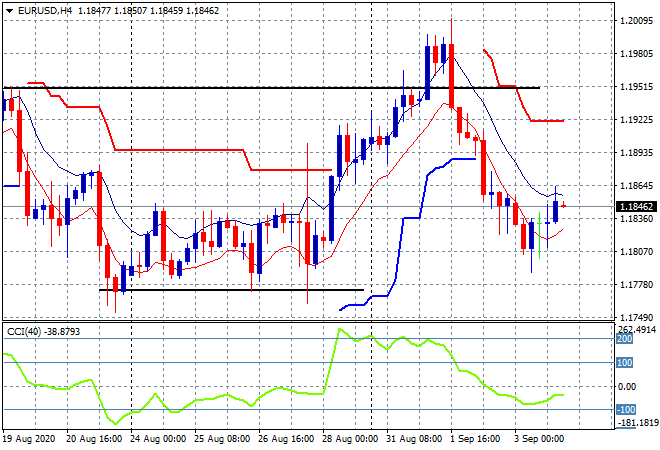
Currency markets took all the stock volatility in its stride with some minor moves around points of control as USD remained strong against the majors. The Euro had a small blip higher but still remains heavily deflated here at the mid 1.18s and in a negative funk with momentum flat lining on the four hourly chart:
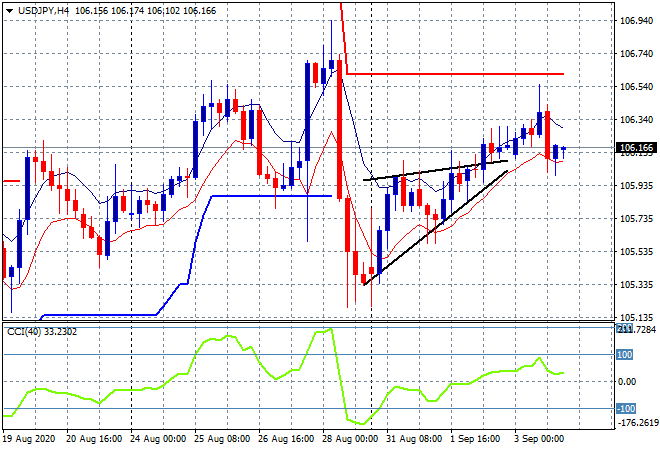
The USDJPY pair flittered around the economic prints but eventually settled just above the 106 level where the price pattern is still suggestive that a short term top is forming here. I’m still watching for any breakout above the high moving average but the bearish rising wedge pattern and the lack of buyers above the 106.30 level is telling:
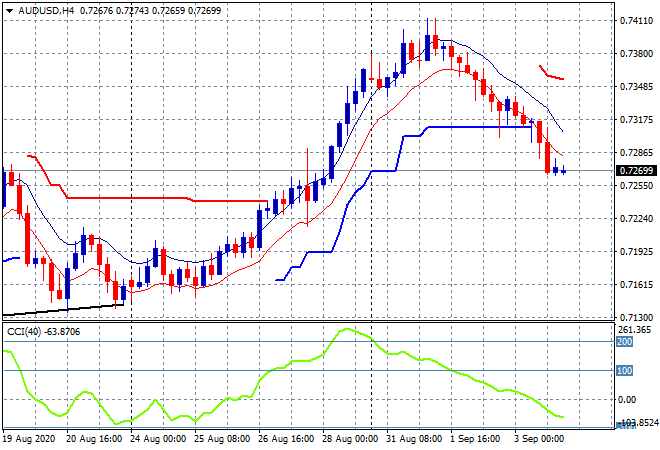
The Australian dollar continued to deflate in a lovely tradeable pattern, heading well below the 73 handle as it moves downwards alongside the risk-off correlation and breaking trailing ATR support. This is not yet oversold and could continue but watch the previous breakout level from last week at the 72.50 level as potential support:
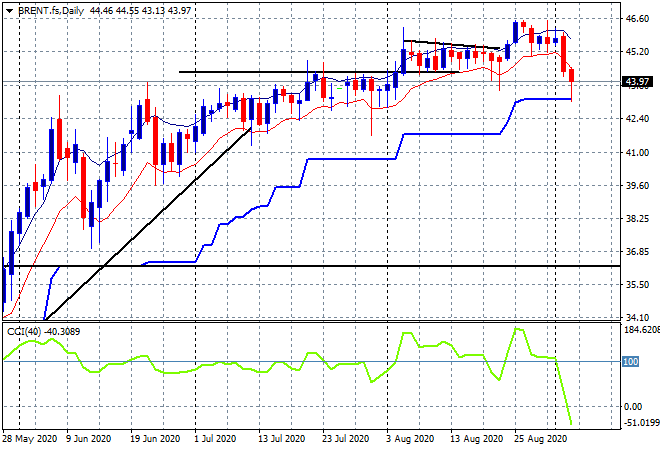
Brent futures continued to fall with another 1% drop overnight, heading back below the $45USD level, almost touching trailing daily support as well. The daily chart shows a clear bearish engulfing candle here that could spell trouble as its been struggling to get moving for quite sometime now. Watch ATR support below at the $43 level to come under stress next:
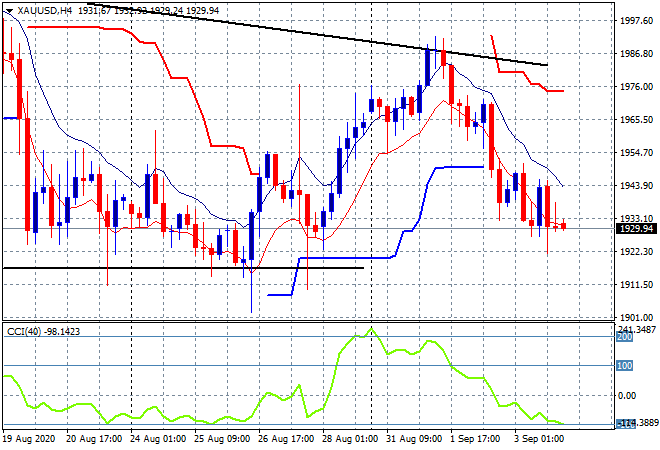
Gold continued to deflate alongside the Australian dollar in a similar pattern, moving back its several week long support level at just below $1930USD per ounce. While there is a deceleration pattern going on here in the short term, this lack of momentum could see it fall back to the monthly support level at $1910 or 1900 very quickly.
Glossary of Acronyms and Technical Analysis Terms:
ATR: Average True Range – measures the degree of price volatility averaged over a time period
ATR Support/Resistance: a ratcheting mechanism that follows price below/above a trend, that if breached shows above average volatility
CCI: Commodity Channel Index: a momentum reading that calculates current price away from the statistical mean or “typical” price to indicate overbought (far above the mean) or oversold (far below the mean)
Low/High Moving Average: rolling mean of prices in this case, the low and high for the day/hour which creates a band around the actual price movement
FOMC: Federal Open Market Committee, monthly meeting of Federal Reserve regarding monetary policy (setting interest rates)
BOJ/Abenomics: Bank of Japan, economic policy/direction enacted by PM Shinzo Abe
DOE: US Department of Energy
Uncle Point: or stop loss point, a level at which you’ve clearly been wrong on your position, so cry uncle and get out!