

By Chris Becker
Wall Street cannot be stopped and was helped along by a very solid ISM manufacturing print, particularly new orders as the Fed stimulus continues to pump up the economy as the presidential election looms. This took the USD slightly higher against the majors, with the latest European CPI print undershooting, while the Australian dollar held on to its post RBA meeting gains. Those maybe fleeting as today’s 2Q GDP print looms into recession territory.
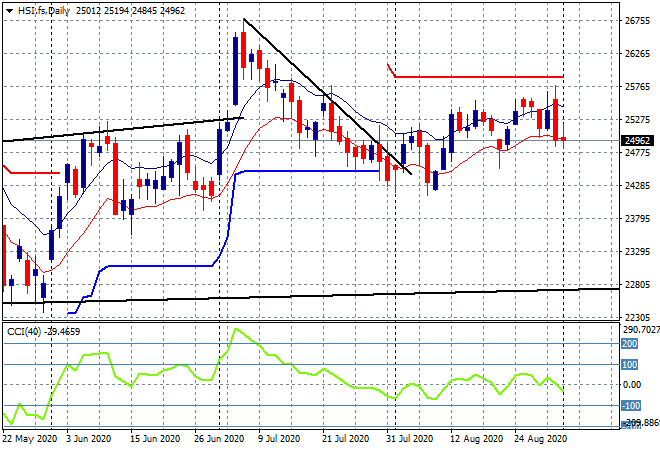
Looking at share markets in Asia from yesterday where in mainland China the Shanghai Composite was looking to put in a scratch session before surging at the close to finish 0.4% higher at 3410 points while in Hong Kong the Hang Seng Index actually did do nothing, up only a handful of points to be at 25184 points. The previous bearish engulfing candle is still warning of a potential breakdown here so watch for any price action below the low moving average as daily momentum craters:
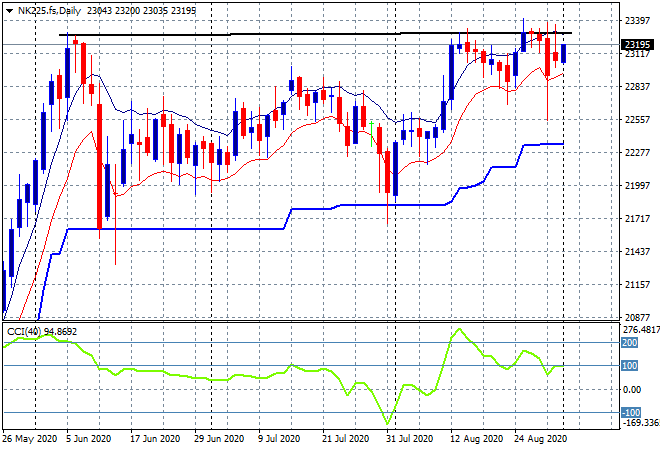
Japanese stock markets also limped along doing nothing, with the Nikkei 225 closing 0.01% – yes you read that right – lower at 23138 points. Futures however are indicating some movement higher on the open today, but only minor as the market tries to retest the May highs again at the 23300 point level:
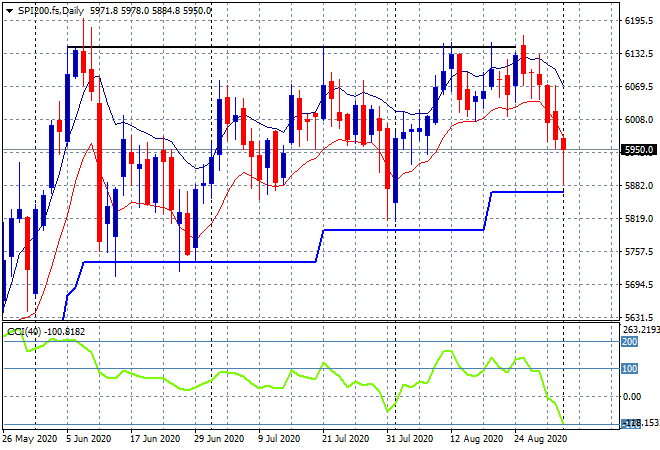
The ASX200 remained the odd one out, pushed significantly lower as the RBA did nothing about the super high Australian dollar to close 1.7% lower at 5953 points as earnings season comes to a close. SPI futures are up around 20 points, a fairly weak response to the exuberance on Wall Street overnight, so it looks like the 6000 point barrier will remain untested as this could turn into a selloff down to trailing ATR daily support nearer the 5800 point level. The daily chart still reveals a market unable to make substantial headway with significant resistance above, mostly due to the lack of confidence in banking stocks (which make up half the index):
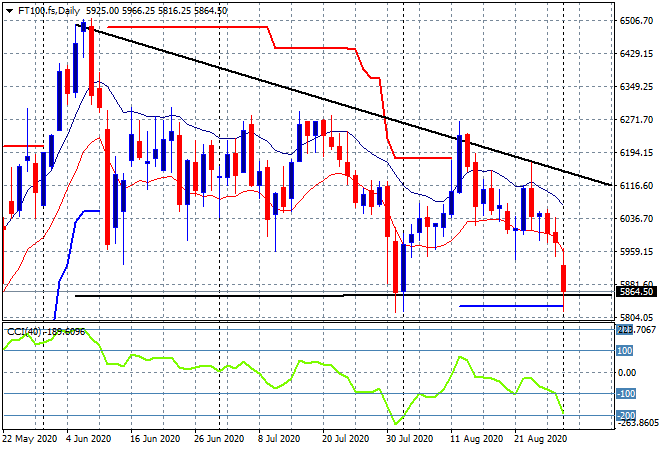
European markets continue to fumble around, with small to broad losses this time across the continent as a much higher Euro and Pound Sterling especially weigh on stocks. The FTSE fell over 1.7%, about the break an ominous descending bearish triangle on the daily chart:
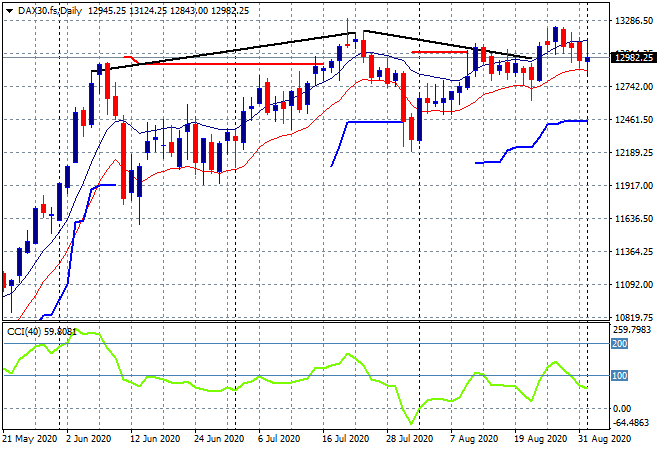
Meanwhile the German DAX was the best of a bad lot, eking out a 0.2% advance but still remaining below the 13000 point level at 12974 points. The daily chart from a distance still looks bullish here, but resistance at 13000 points is firming again – I’m still waiting for a potential further retracement below the low moving average:
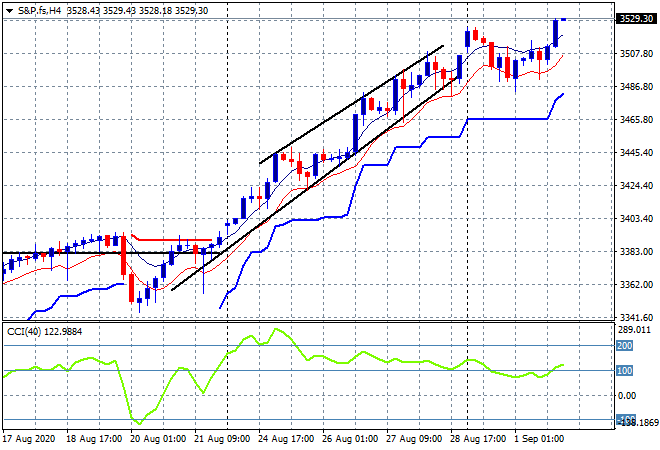
Wall Street brushed aside the minor one day dip and soared to new highs again with the “cut and paste this again” NASDAQ pushing to a new record high due, up 1.4% while the S&P500 re-loaded and lifted 0.7% to 3526 points. The four hourly chart showed this minor blip was filled nearly instantly as this market remains in exuberant mode, ready to pop even higher:
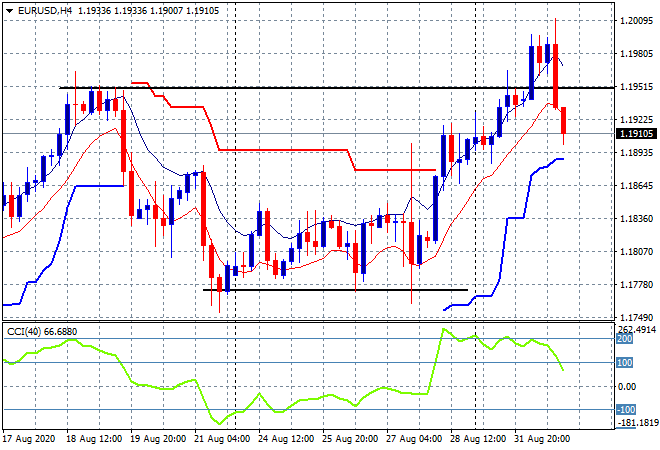
Currency markets pivoted away from the weaker USD as most majors sold off in the wake of the ISM print. Pound Sterling held on to its surge gains while Euro broke down after hitting the 1.20 level, but still remains at a weekly high. I suggested yesterday that four hourly momentum was getting way overbought but this swing could be just that, temporary and fleeting before the USD is old off once again. I’m watching trailing ATR support at the 1.19 handle proper here:
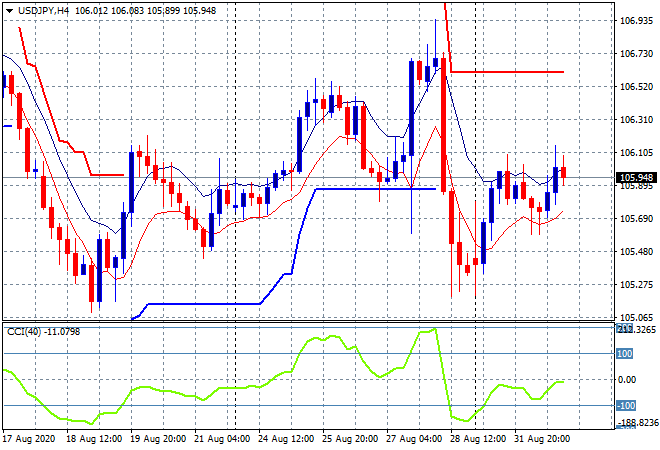
The USDJPY pair was relatively calm with a very small upswing on USD strength back to the 106 level before staying still going into this morning’s session. I’m still watching for any breakout above the high moving average on the four hourly chart to have legs here, as momentum is not yet positive:
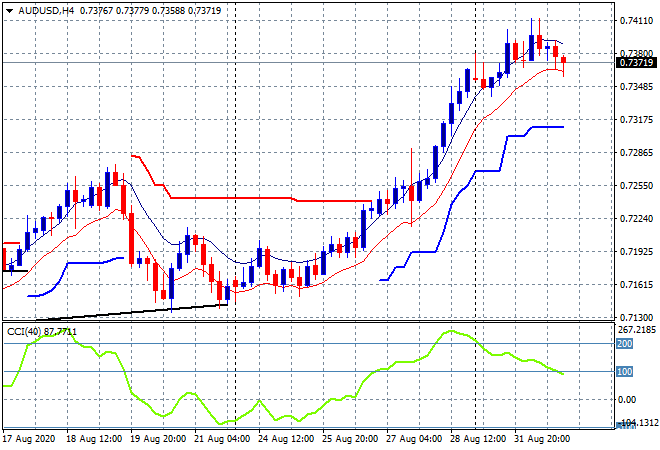
After reaching a two year high, the Australian dollar tried in vain to stay above the 74 handle post the RBA meeting before retracing slightly to still be above its Friday finishing highs. This is a classic rollover pattern, so watch for the inevitable selloff below the low moving average as swing down play in the short term, but overall my terminal target is still intact at 80 cents:
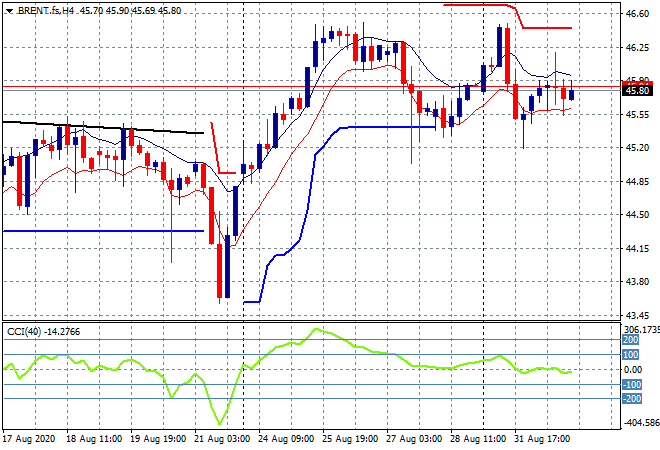
Oil futures came back slightly as volatility builds again with Brent gaining almost 1% to be just below the $46USD per barrel level overnight. The four hourly chart shows a market poised and ready to break above the $46 level but may require an external catalyst to get moving:
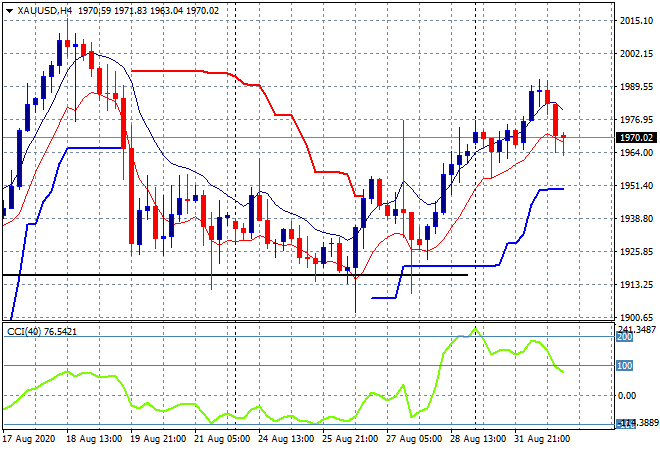
Gold was firming slightly before the ISM print but sold off over $20USD per ounce to finish at the $1970USD per ounce level with a lot of intrasession buying support. Note how price continues to be supported at the several week long $1930USD per ounce level, but also short term support around a point of control near $1960. It still needs a bit more momentum here before calling a new uptrend in comparison with other undollar assets:
Glossary of Acronyms and Technical Analysis Terms:
ATR: Average True Range – measures the degree of price volatility averaged over a time period
ATR Support/Resistance: a ratcheting mechanism that follows price below/above a trend, that if breached shows above average volatility
CCI: Commodity Channel Index: a momentum reading that calculates current price away from the statistical mean or “typical” price to indicate overbought (far above the mean) or oversold (far below the mean)
Low/High Moving Average: rolling mean of prices in this case, the low and high for the day/hour which creates a band around the actual price movement
FOMC: Federal Open Market Committee, monthly meeting of Federal Reserve regarding monetary policy (setting interest rates)
BOJ/Abenomics: Bank of Japan, economic policy/direction enacted by PM Shinzo Abe
DOE: US Department of Energy
Uncle Point: or stop loss point, a level at which you’ve clearly been wrong on your position, so cry uncle and get out!