
With Australia’s property market now declining for four consecutive months, it’s an opportune time to compare this current nascent correction with prior episodes.
The below chart shows the various dwelling corrections over the past 30-plus years at the 5-city level, as measured by CoreLogic:
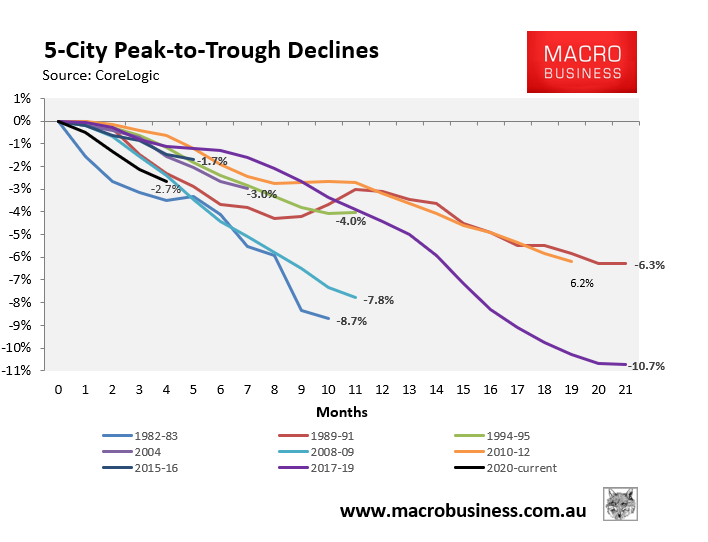
As you can see, this bust is only in its infancy, with the property market so far falling 2.7% over four months. However, property values across the five major capitals are falling at their second fasted rate on record behind the 1982-83 correction.
Advertisement
