

By Chris Becker
The record highs on Wall Street keep coming while European shares found some hesitation even as the closely watched IFO survey came in strong as the continental recovery seems on track – bar a second wave of COVID-19. USD faltered from its recent streak, sending Yen and Euro higher while oil prices continued their breakout due to production threats in the Gulf of Mexico. Treasury yields also lifted to a weekly high even as US home sales were strong.
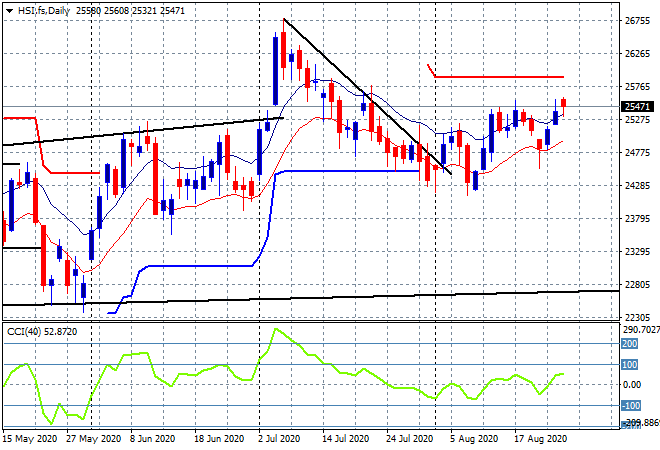
Looking at share markets in Asia from yesterday where in mainland China the Shanghai Composite slipped a little, down 0.2% to 3377 points while in Hong Kong the Hang Seng Index has stumbled as well, down 0.4% to 25486 points. Price is still ready to push higher again through resistance around the 25400 point level but note the long tails above on the daily chart that is indicative of some selling pressure ahead:
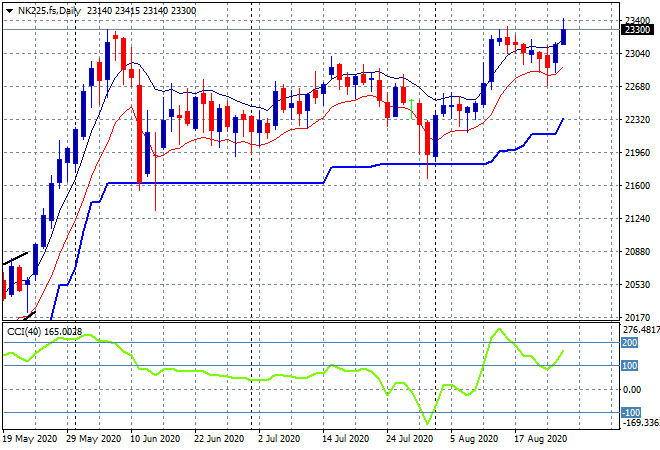
Japanese stock markets however are doing a lot better, with the Nikkei 225 closing 1.3% higher at 23296 points. Futures are indicating a flat start to today in line with non-Wall Street markets as resistance at or around the 23000 point level on the daily chart still needs to be cleared substantially to beat the late May highs:
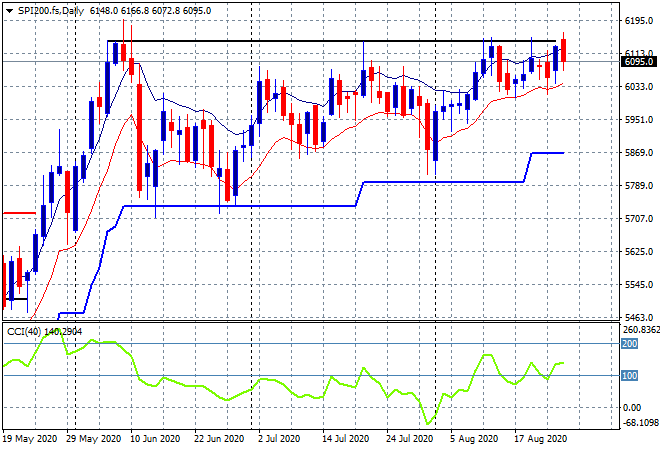
The ASX200 had a solid session as well, gaining just on 0.5% to 6161 points as earning season rolls on. SPI futures however are looking to retrace most of that advance, down at least 30 points as resistance at the May highs remains the level to beat (upper black horizontal line) even though the daily chart still looks quite bullish and ready to breakout here. Today’s earnings include c:
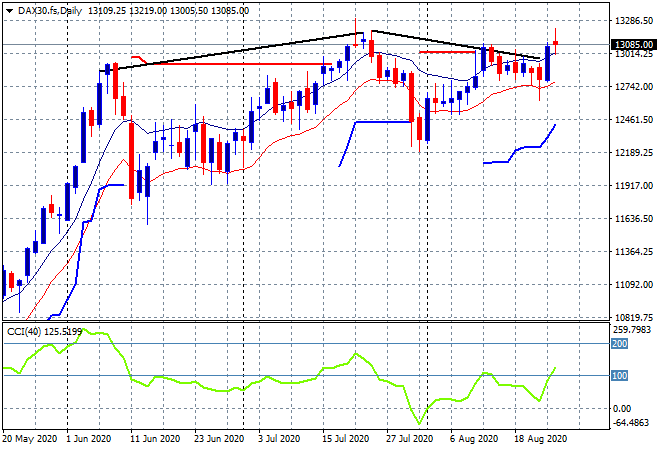
European markets seemed to have caught a frog in their collective throats as most stumbled with scratch sessions and minor losses overnight following a stonking session yesterday. The German DAX fell back five points after being up substantially more mid-session, closing at 13061 points as Euro came back slightly against USD. The daily chart had an interesting rounding or triple top bearish pattern building that required full clearance of the 13000 point level to be negated and so far, so good…but:
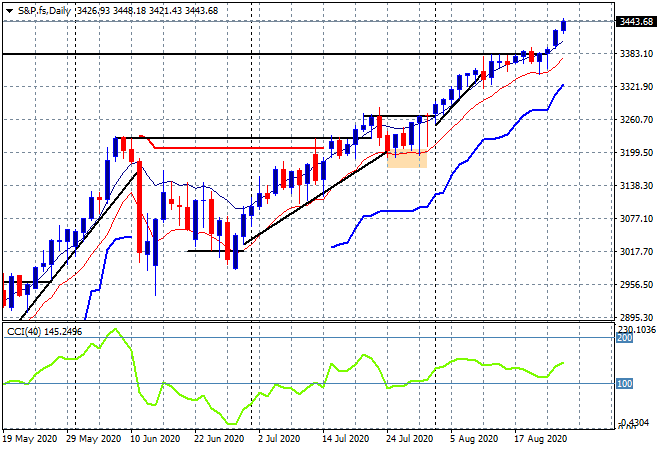
Wall Street continues higher because everything is awesome or insert any excuse here. The S&P500 gained 0.4% to 3443 points to a yet another new record high, while the NASDAQ advanced twice that, now truly echoing the 1999 bubble. The daily chart still shows a great breakout here above the 3400 point level that is considerably overbought but none of that matters – buy buy buy:
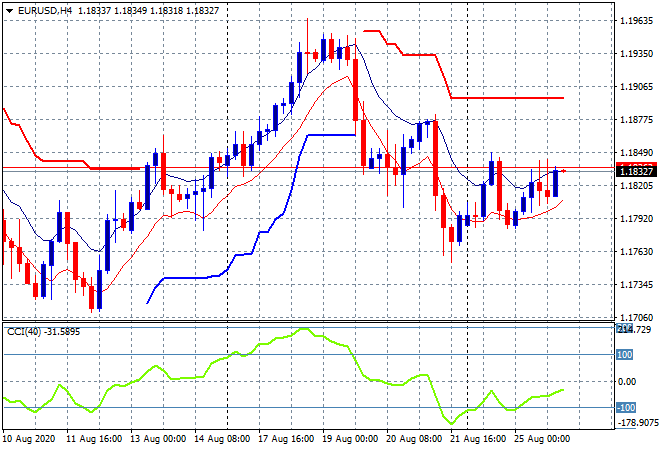
Currency markets came back slightly against USD as traders await the Jackson Hole conference and the expected remarks of Fed Chair Powell that should be very accomodative. Euro tried again to get back towards the 1.19 handle, and most of this stuck but there’s considerable selling resistance at the 1.1850 level to overcome here as momentum remains negative:
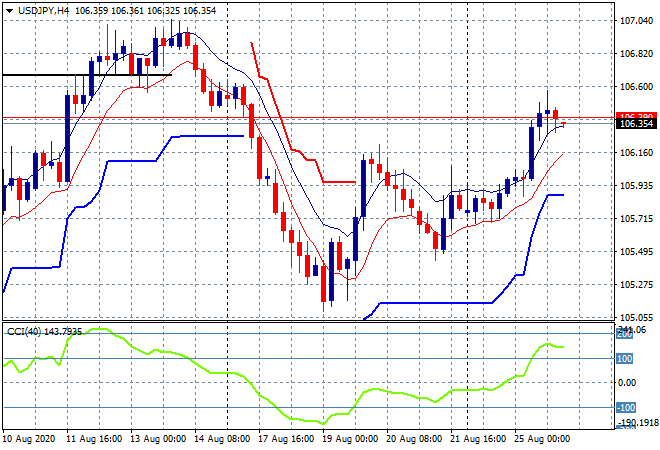
The USDJPY pair continued its previous minor breakout and crossed well into the 106 level before getting ahead of itself and moderating at the 106.30 level this morning. Four hourly momentum has gone considerably overbought now but could still put in another leg as price tries to go back to the previous weekly high at the 107 hanlde:
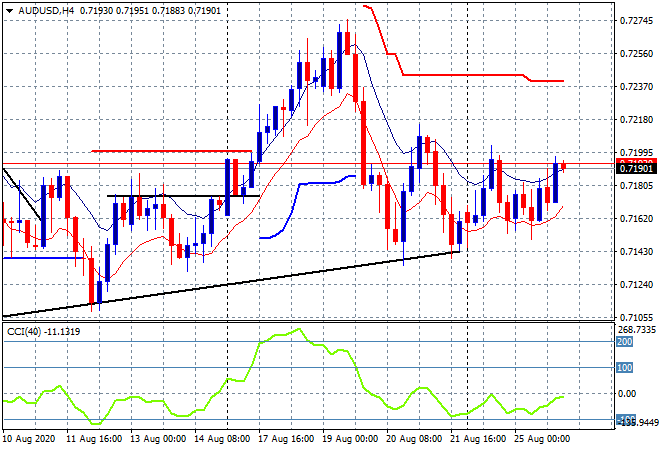
The Australian dollar was unable to move much again, with last night’s session seeing another weak move back to the 72 handle that stuck but didn’t produce any new intra-week session highs. Note how price is right on the daily uptrend line (black line at the 71.40 intersection) and could struggle to maintain this nascent support level:
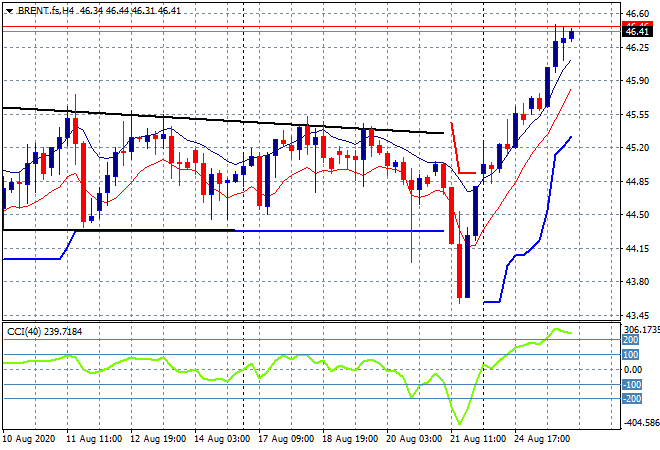
Oil futures continue to lift strongly due to the shutdown on oil rigs in the Gulf of Mexico and the biggest US refinery in the wake of two hurricanes barrelling down, with both Brent and WTI markers up nearly 2%, with Brent finally back above the $46USD per barrel level. As I said yesterday, this breakout could get higher if the storms get worse with a new weekly high if it can hold here that should shake up the currently neutral positions in most portfolios:
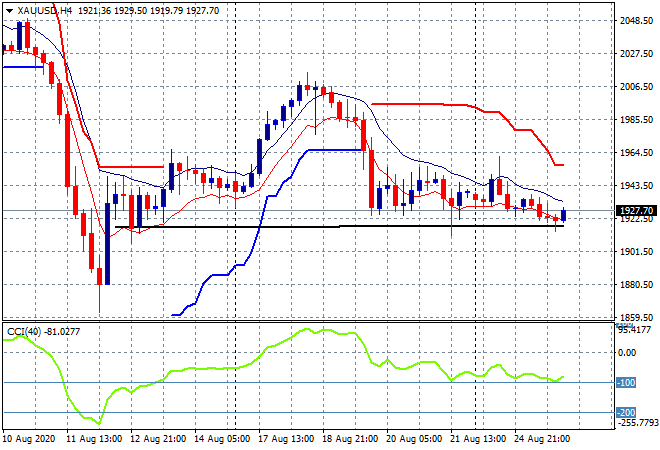
Gold remains unable to get anywhere, still sitting just above previous four hourly support near the $1930USD per ounce level despite USD weakening a little overnight. The bearish head and shoulders pattern has fully formed on the four hourly chart providing short positions an opportunity to get in if the shoulder breaks here:
Glossary of Acronyms and Technical Analysis Terms:
ATR: Average True Range – measures the degree of price volatility averaged over a time period
ATR Support/Resistance: a ratcheting mechanism that follows price below/above a trend, that if breached shows above average volatility
CCI: Commodity Channel Index: a momentum reading that calculates current price away from the statistical mean or “typical” price to indicate overbought (far above the mean) or oversold (far below the mean)
Low/High Moving Average: rolling mean of prices in this case, the low and high for the day/hour which creates a band around the actual price movement
FOMC: Federal Open Market Committee, monthly meeting of Federal Reserve regarding monetary policy (setting interest rates)
BOJ/Abenomics: Bank of Japan, economic policy/direction enacted by PM Shinzo Abe
DOE: US Department of Energy
Uncle Point: or stop loss point, a level at which you’ve clearly been wrong on your position, so cry uncle and get out!