

By Chris Becker
More record highs on Wall Street on Friday night with a slowdown in new COVID-19 cases and better than expected PMIs lifting sentiment across the board although again, European share markets are hesitant at best. This boosted the USD as well, lifting the Dollar Index more than 0.5% with gold falling alongside Euro. Commodities also fell back with oil almost breaking down on both the WTI and Brent markers while the most important market – bonds – saw another drop in 10 year Treasury yields. The risk complex remains over stretched and ready to whip as low volatility begets a high volatility breakdown soon.
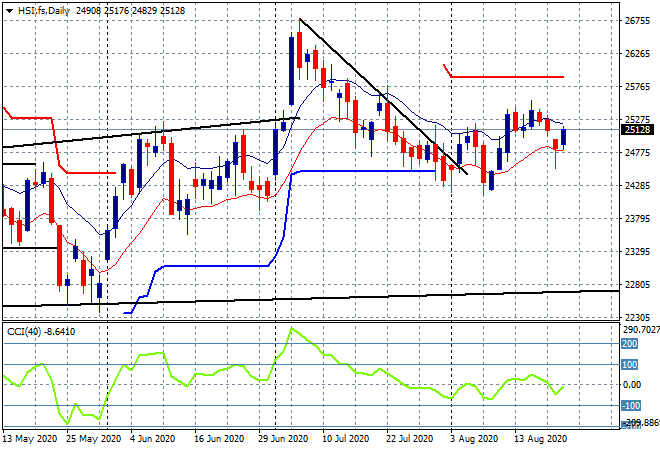
Looking at share markets in Asia from Friday’s close where in mainland China, the Shanghai Composite rebounded from its recent falls, closing 0.5% higher to 3380 points while in Hong Kong the Hang Seng Index gained even more, finishing more than 1% higher at 25113 points. This snaps back price that had gapped down significantly in the previous session, indicating that resistance at the 25400 point level was far too strong. But as I suggested last week strong support at the recent daily lows at 24300 points is holding on here even though daily momentum remains negative. Watch for a potential breakout above the high moving average to re-engage the bullish trend:
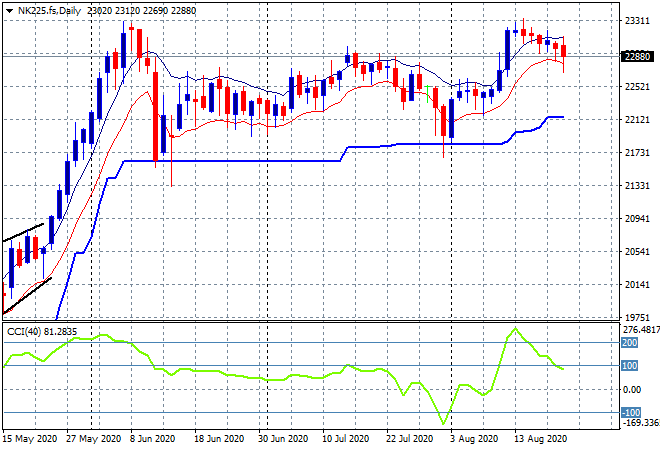
Japanese stock markets basically had scratch sessions however, with the Nikkei 225 closing 0.1% higher at 22920 points. Futures are indicating a slight pullback as price remains unable to stave off resistance at or around the 23000 point level as the daily chart still shows an inability to beat the late May highs:
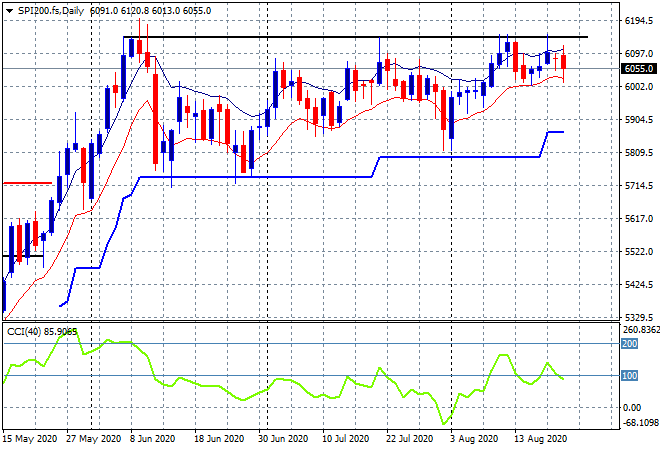
The ASX200 had little to no confidence to finish the week down 0.1% at 6111 points. SPI futures are down at least 10 points despite the Wall Street bounce as resistance at the May highs remains the level to beat (upper black horizontal line) as we start another trading week and further earnings reports – and possibly more lockdowns. Watch for iron ore behemoth Fortescue (FMG) in today’s earnings:
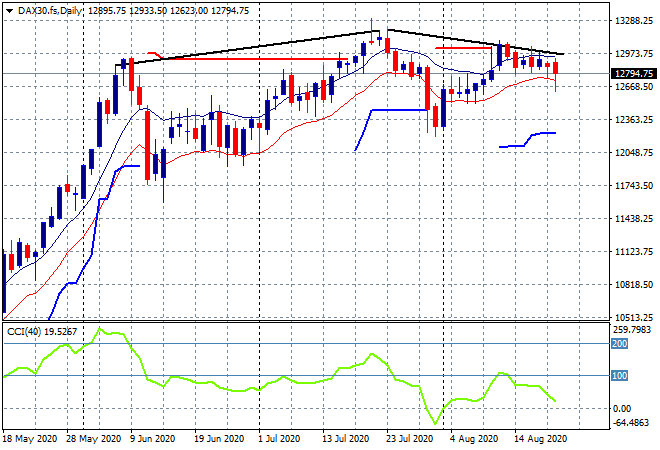
European markets remain in a cautious mood post the release of the ECB minutes as new breakouts on the continent overshadow some good news in manufacturing and service PMI prints. The German DAX was representative of the wider trend, finishing 0.5% lower at 12764 points, despite a stronger Wall Street. The daily chart continues to paint a troubling picture here, with the rounding or triple top bearish pattern building and still requiring a full clearance of the 13000 point level. Watch the low moving average first for any signs of trouble:
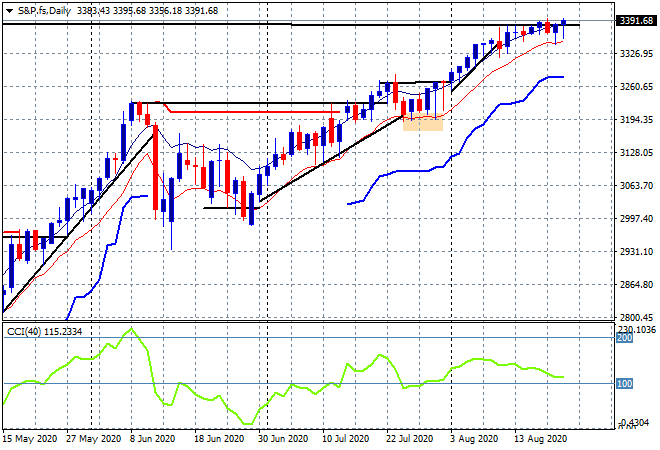
You still can’t stop the music, with Wall Street advancing across the board again with the S&P500 gaining 0.3% to 3397 points to a new record high, again back above its previous record high while the NASDAQ reached the stratosphere with a 0.4% advance above 12300 points. The daily chart shows how well the BTFD crowd performs whenever there’s even a hint of a minor pullback with price still engaged above the high moving average and momentum still nicely overbought – nobody can stop the music….
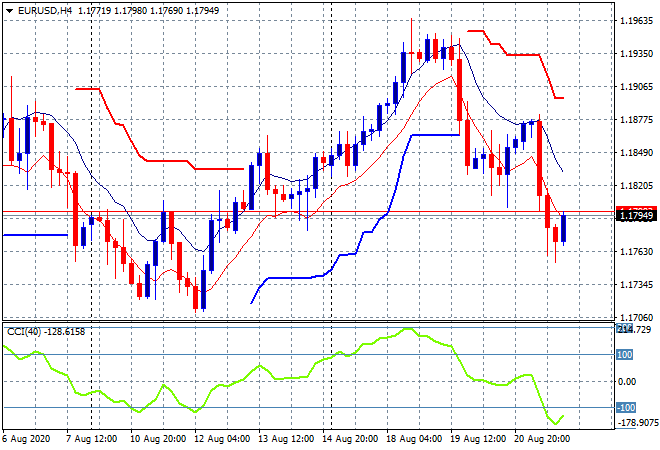
Currency markets are firming once more in the USD favour alongside sovereign bonds with Friday night seeing the Euro hit down from a failed rebound, losing ground below the 1.18 level. Momentum was oscillating around the zero line but sharply fell on the PMI prints, almost making a new weekly low. Now considerably oversold, watch for a potential small swing play higher but there is longer term potential for more downside here:
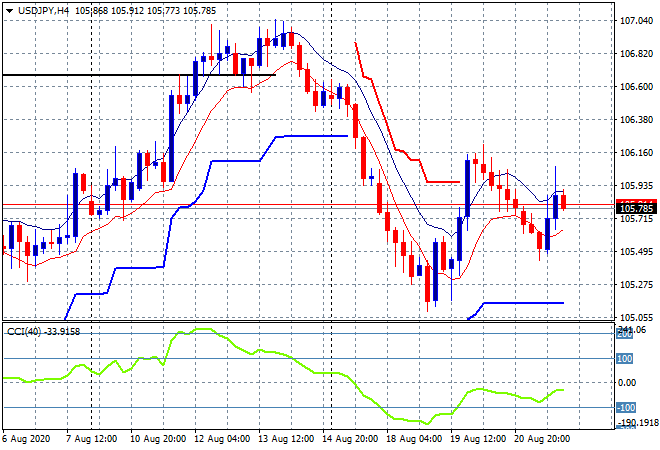
The USDJPY pair wasn’t able to advance further despite the uplift in USD, pushed back below the 106 level and unable to beat its mid-week intrasession high. Notably four hourly momentum has never been positive last week so this indicates price will have a tough time starting this week, but watch for the usual weekend gap play:
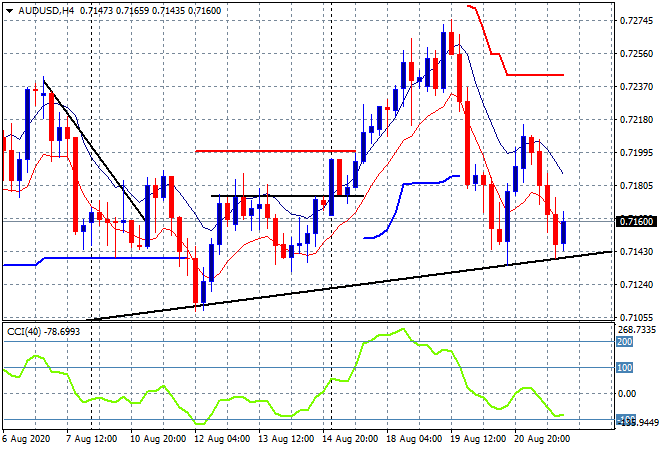
The Australian dollar flailed again after a recent swing back from the low 71s to just below the 72 level, when Friday’s session snapped it down back to the weekly low at the 71.60 level. Note how price is right on the daily uptrend line (black line at the 71.40 intersection) and could struggle to maintain this nascent support level on the open today:
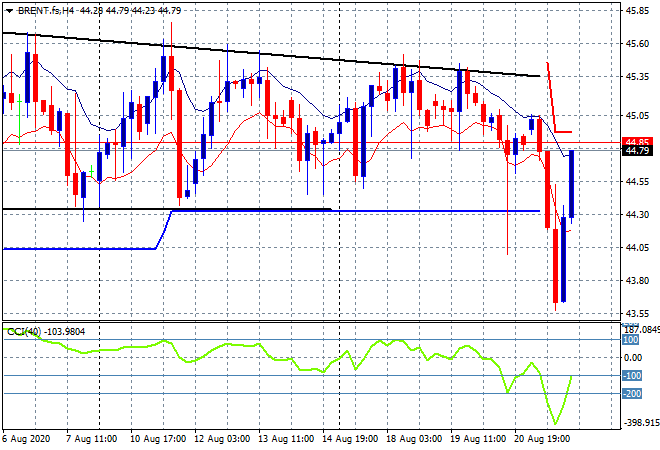
Oil futures are starting to get interesting with a small breakdown – and then filled – on Friday night on both Brent and WTI markers, which ended 1% lower, with the former remaining below the $45USD per barrel level. The four hourly chart shows a market still unable to capitalise on its previous weekly breakout above the $44.30 level with considerable resistance overhead, but support is no longer firm at the $44.30 level and while some shorts got burnt on Friday with the swing back to the control point, there is more volatility brewing here:
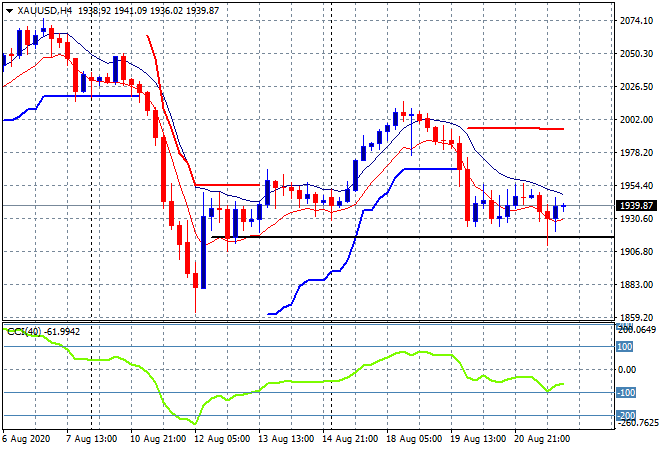
Gold remains unable to get anywhere as well, sitting just above previous four hourly support at the $1930USD per ounce level as USD continues to firm. There’s an interesting bearish head and shoulders pattern now fully formed on the four hourly chart providing short positions an opportunity to get in if support at the $1930 level breaks:
Glossary of Acronyms and Technical Analysis Terms:
ATR: Average True Range – measures the degree of price volatility averaged over a time period
ATR Support/Resistance: a ratcheting mechanism that follows price below/above a trend, that if breached shows above average volatility
CCI: Commodity Channel Index: a momentum reading that calculates current price away from the statistical mean or “typical” price to indicate overbought (far above the mean) or oversold (far below the mean)
Low/High Moving Average: rolling mean of prices in this case, the low and high for the day/hour which creates a band around the actual price movement
FOMC: Federal Open Market Committee, monthly meeting of Federal Reserve regarding monetary policy (setting interest rates)
BOJ/Abenomics: Bank of Japan, economic policy/direction enacted by PM Shinzo Abe
DOE: US Department of Energy
Uncle Point: or stop loss point, a level at which you’ve clearly been wrong on your position, so cry uncle and get out!