

By Chris Becker
More Americans out of work? Wall Street goes higher. More Americans dying of COVID-19? Wall Street goes higher. Well, to be clear, five stocks on Wall Street go higher – the big tech issues and nothing else. After being down during the session due to the much higher than expected initial jobless claims print, NASDAQ finished to a new record high, dragging the S&P500 higher with it, while European stocks remained in the doldrum as the ECB rightly expressed uncertainty in its latest minutes. Commodities fell nearly across the board, with oil prices off 1% alongside copper and other industrials, while gold tried to climb back from its recent losses as USD maintained its recent strength.
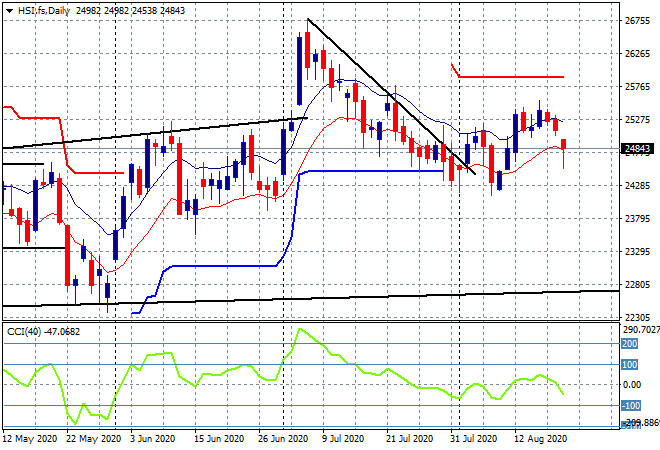
Looking at share markets in Asia from yesterday where in mainland China, the Shanghai Composite continued its fall from the previous session, losing 1.3% to 3363 points while in Hong Kong the Hang Seng Index fell in lockstep, closing 1.5% lower to 24971 points. Price has gapped down significantly here indicating that resistance at the 25400 point level was far too strong and as I warned previously, the lack of a stronger uptrend pointed to this rollover. Its not all said and done though, with support still indicative at the recent daily lows at 24300 points:
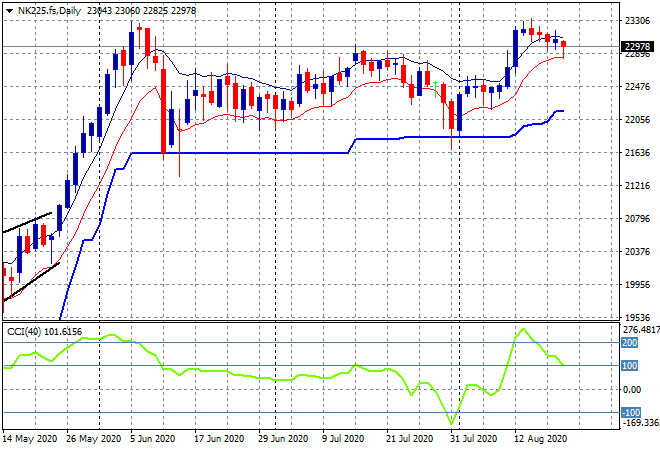
Japanese stock markets joined in with the wider selloff, despite a lower Yen, with the Nikkei 225 closing 1% lower at 22875 points. Futures are indicating not much activity, maybe a fill or stability at or around the 23000 point level but the daily chart still shows an inability to make any advance above the high moving average in an attempt to beat the late May highs:
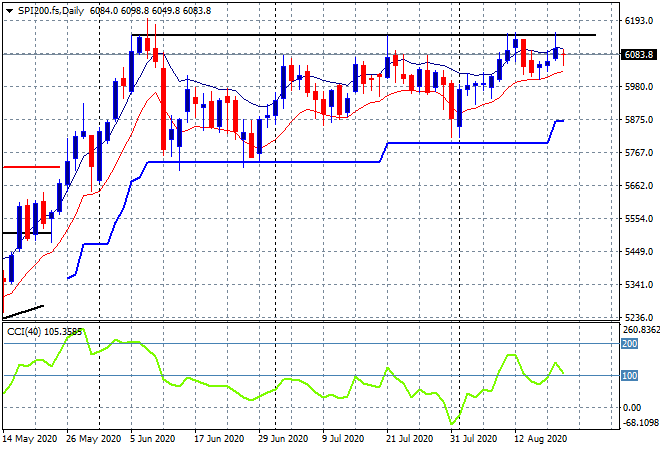
The ASX200 was the best off, but only relatively as it took back all of yesterday’s gain to fall 0.8% to 6120 points. SPI futures are up nearly 10 points on the Wall Street bounce but resistance at the May highs remains the level to beat (upper black horizontal line) to finish this trading week. Watch for Suncorp (SUN) in today’s earnings:
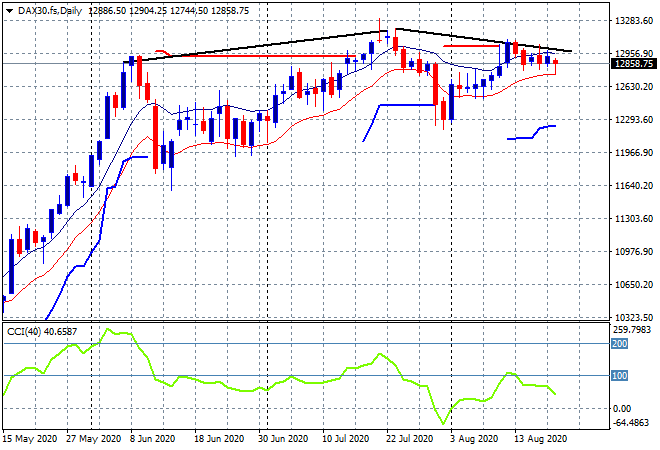
European markets reversed their very temporary uptrend overnight as the cautious ECB minutes put paid to any further risk taking with the German DAX finishing 1.1% lower to close at 12811 points, although some of this was pared back in futures. The daily chart continues to paint a troubling picture here, with the rounding or triple top bearish pattern continuing to form and still requiring a full clearance of the 13000 point level. Watch the low moving average first for any signs of trouble:
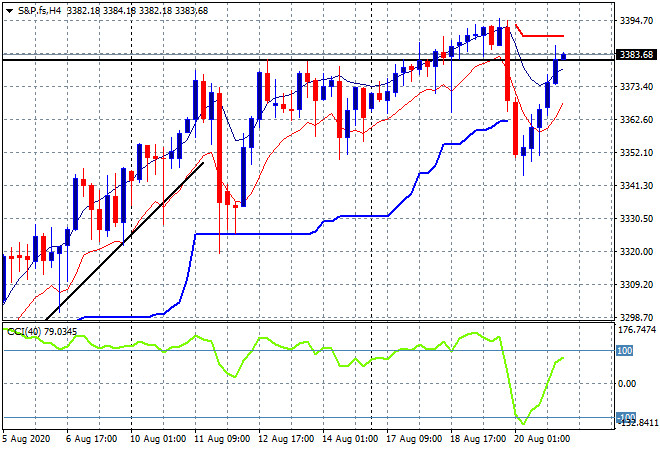
You can’t stop the music, regardless of the tosh on the radio with Wall Street advancing across the board again, and after making new sessions lows to boot. The S&P500 gained 0.3% to 3385 points, almost getting back to its previous record high while the NASDAQ reached the stratosphere. The four hourly chart shows this nice bounce but as I warned yesterday, the dip below trailing ATR support below was immediately filled in by the BTFD crowd:
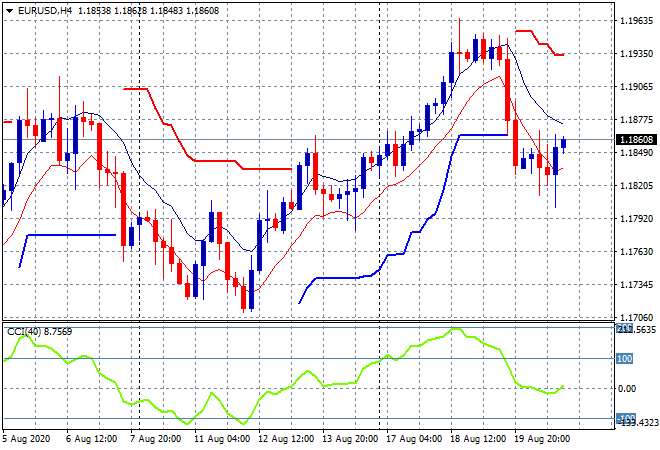
Currency markets oscillated around the US initial jobless claims and ECB minutes release with the USD effectively unchanged, although Euro had a sniff below the 1.18 level before recovering this morning. Momentum is oscillating around the zero line here with short term bearishness still baked in, but watch for a volatile breakout possibility above 1.1880:
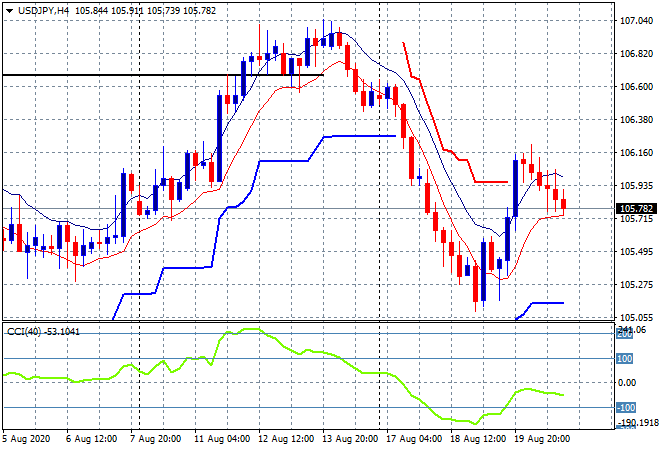
The USDJPY pair has been unable to hold on to its strong reversal play and took back more than half of this bounce in the last 24 hours in a constant nosedive, finishing well below the 106 handle this morning. Notably however, price hasn’t retraced below the low moving average but momentum on the four hourly chart remains negative and could point to further falls today:
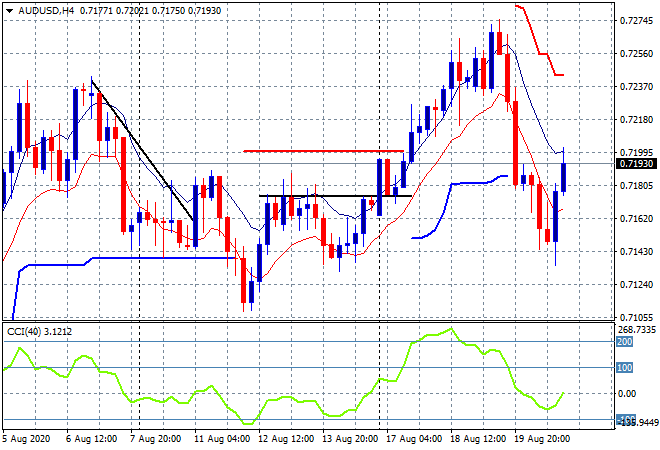
The Australian dollar tried its own bounceback overnight, swinging back from the low 71s to be just below the 72 level before the Sydney open this morning in what looks like a weak move all round. Momentum never really got rolling in this move and will likely struggle to get above the 72 handle today:
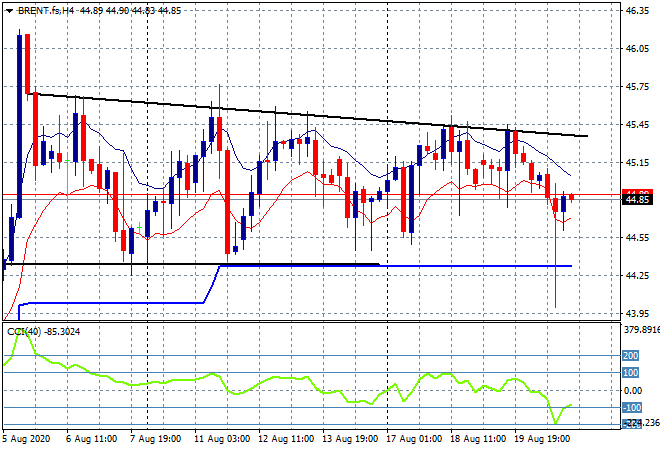
Oil futures still can’t gain traction with both Brent and WTI futures falling over 1% overnight, with the former falling below the $44USD per barrel level briefly before coming back to its start of week level. The four hourly chart shows a market still unable to capitalise on its previous weekly breakout above the $44.30 level with considerable resistance overhead, but support remains nice and tight at the $44.30 level:
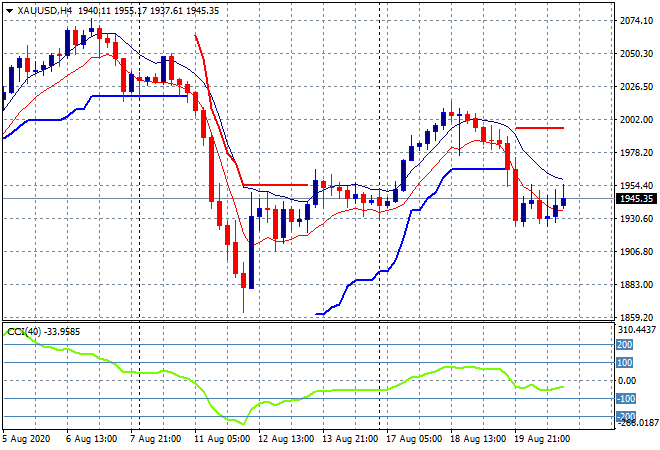
Gold remains poised again, this time unable to make any headway back above previous four hourly support at the $1960USD per ounce level, instead gravitating and seemingly anchored to the $1930 level with a lot of upside selling going on. As I’ve said all week, continue to watch key support at the $1930 level to hold and if it doesn’t, the next level is below $1900 at the recent correction lows:
Glossary of Acronyms and Technical Analysis Terms:
ATR: Average True Range – measures the degree of price volatility averaged over a time period
ATR Support/Resistance: a ratcheting mechanism that follows price below/above a trend, that if breached shows above average volatility
CCI: Commodity Channel Index: a momentum reading that calculates current price away from the statistical mean or “typical” price to indicate overbought (far above the mean) or oversold (far below the mean)
Low/High Moving Average: rolling mean of prices in this case, the low and high for the day/hour which creates a band around the actual price movement
FOMC: Federal Open Market Committee, monthly meeting of Federal Reserve regarding monetary policy (setting interest rates)
BOJ/Abenomics: Bank of Japan, economic policy/direction enacted by PM Shinzo Abe
DOE: US Department of Energy
Uncle Point: or stop loss point, a level at which you’ve clearly been wrong on your position, so cry uncle and get out!