

By Chris Becker
Wall Street was again pushed higher by tech stocks as the NASDAQ lifted 1%, while European stocks followed meekly in a session lacking any significant news or data events. Bond yields continued to firm however with a weaker USD pushing commodities higher, alongside undollar assets like gold, Bitcoin (above $12000) and the Australian dollar.
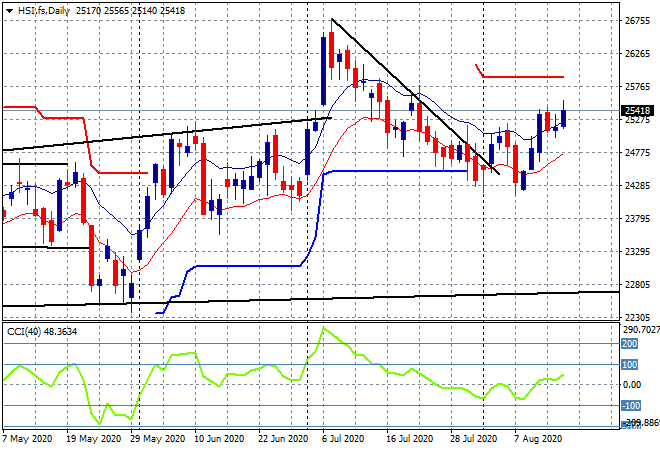
Looking at share markets in Asia from yesterday where in mainland China, the Shanghai Composite was boosted by some central bank juice, up more than 2% to the 3438 point level while in Hong Kong the Hang Seng Index was also pulled along, closing 0.7% higher to 25347 points. This sets up a nice breakout on the daily chart after momentum had been a bit listless here, with price now gravitating more towards the high moving average we could see a stronger trend develop:
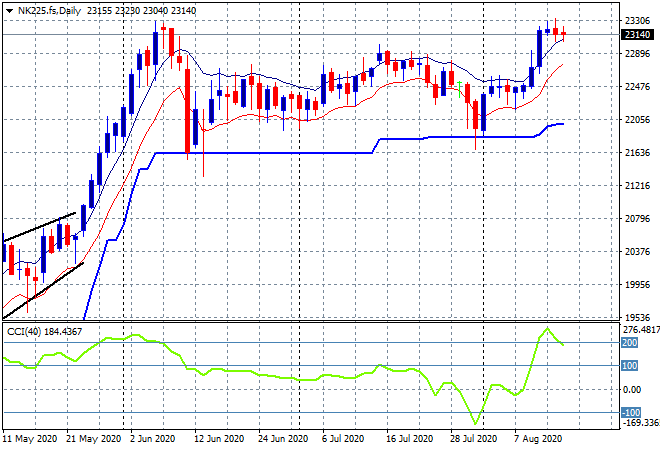
Japanese stock markets however lost their way, with the Nikkei 225 closing 0.8% lower at 23096 points, unable to beat the previous July highs. Fortunately futures are indicating a better start this morning and while momentum remains extremely over stretched, price remains poised above the high moving average with the 23000 point support level under pressure but not yet broken:
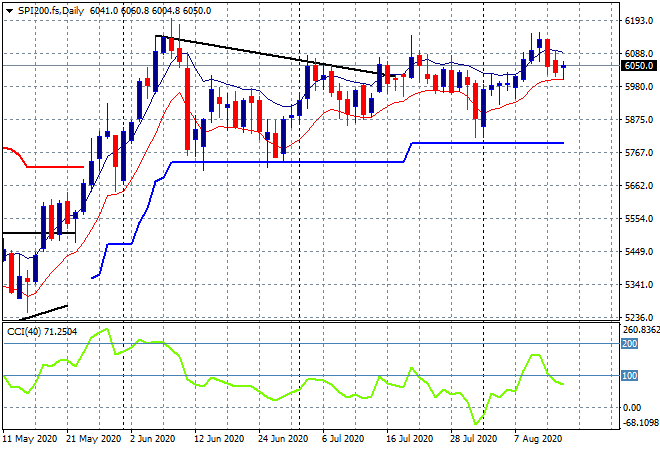
The ASX200 lost ground as expected, falling some 0.8% to 6076 points as earnings season progresses. SPI futures however are suggesting a fill of most of this loss due to the ebullient mood on Wall Street, up 0.5% or more but its resistance at the May highs that remains the level to beat. Watch for the BHP and Cochlear (COH) earnings and Westpac 3Q update today to jolt things around:
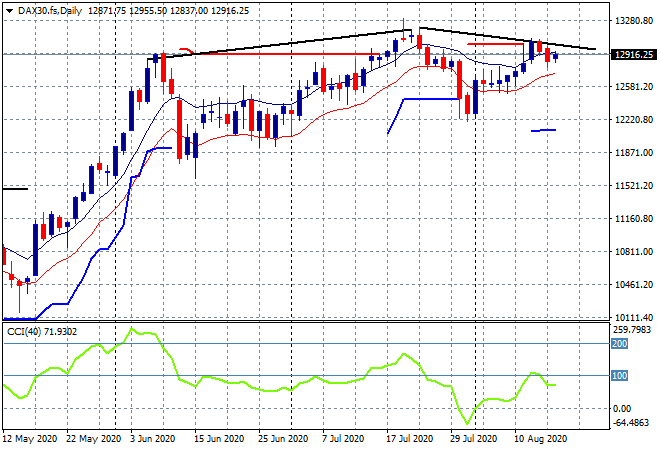
European markets lifted slightly across the continent although the FTSE outshone them all with a 0.6% gain, as the German DAX eked up a minor 0.1% lift, closing at 12920.The daily chart was looking firm here last week with solid momentum but the rounding or triple top bearish pattern continues to form here that still requires a clearance of the May highs and the June false high well above the 13000 point level:
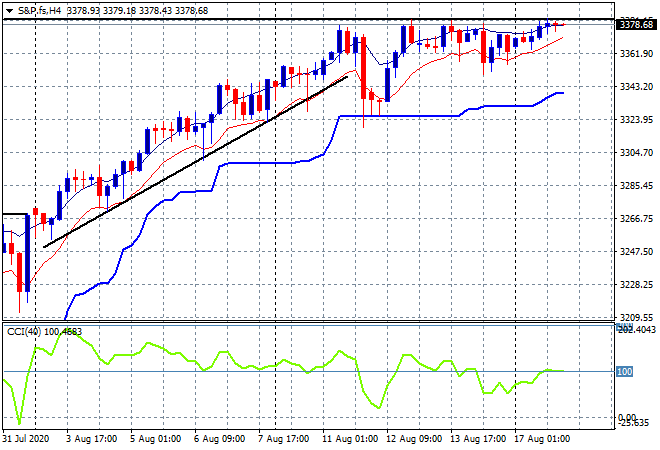
Wall Street will not be stopped, all bears will be assimiliated, resistance is futile! With the NASDAQ up 1%, the S&P500 was pushed 0.3% higher at 3381 points, almost matching the the pre-pandemic highs (solid black horizontal line) with daily momentum still on track. I still contend this has the feeling of butter spread too thin on toast at any angle, but flip this chart upside down and you’d be short in an instant, so….
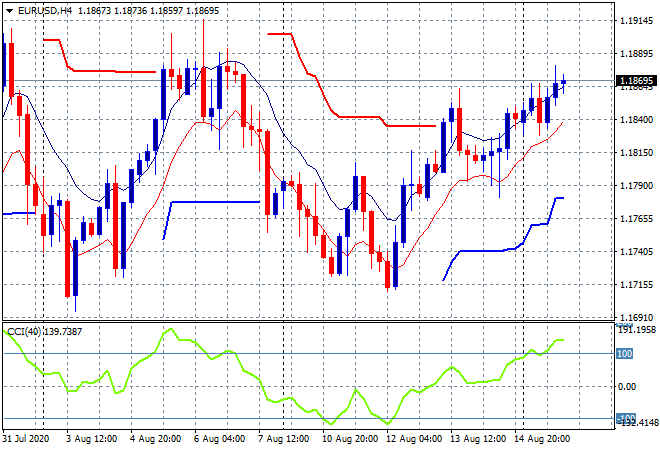
Currency markets are again pivoting to a weaker USD in general with Euro pushing higher overnight to beat last week’s intrasession high, just short of the previous week high at the 1.19 handle proper. A nice bounce from last week’s low that is still sustainable even though now in overbought territory, but without any other catalysts, not much in the way:
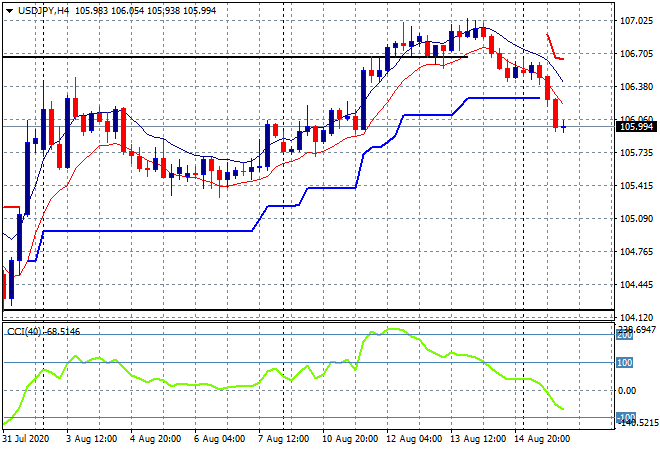
The USDJPY pair didn’t fall sharply on the weekend gap open but caught up overnight as USD was sold off, pushing the pair below the 106 level in a very easy fashion. This was an easy trend to follow down and may have more downside as we get back to weekly support at the 105.50 level:
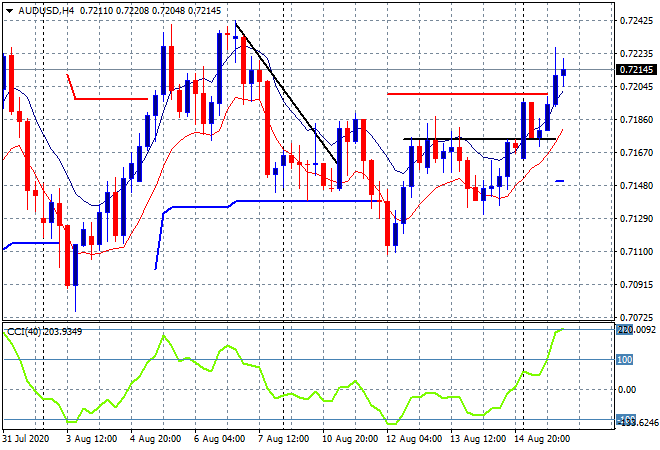
The Australian dollar is no longer the weakest against USD, this time pushing right through the 71.70 level overnight after a feint move earlier in the Asian session and almost reaching the previous weekly highs above the 72 handle. This is a very solid move that may get wobbly with the release of the latest RBA minutes today so watch the 72 level for signs of buying support:
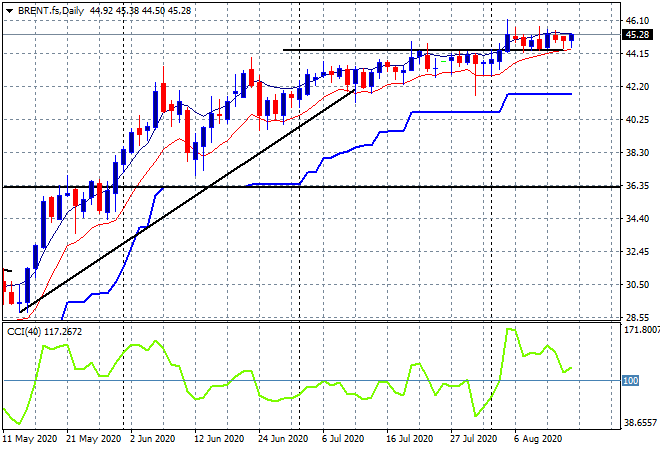
Oil futures still can’t gain traction with the Brent again oscillating around the $45USD per barrel level, with WTI futures pushing slightly further ahead last night. The daily chart of Brent still shows a market unable to capitalise on its previous weekly breakout above the $44.30 level with considerable resistance overhead, but support remains nice and tight at the $44 level:
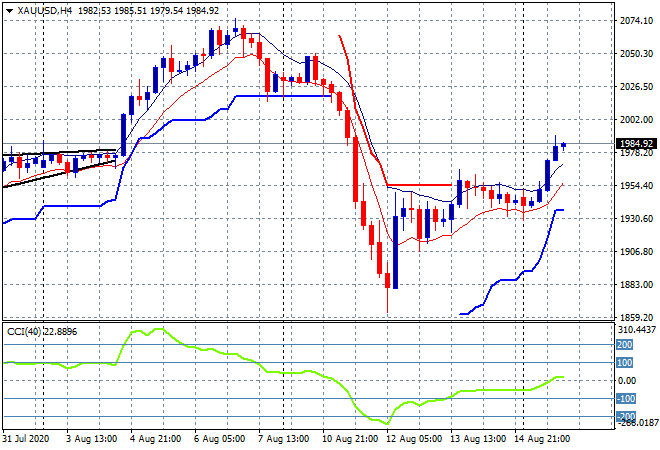
After taking a breather after a tumultuous week, gold found some life in the wake of a weaker USD, breaking out above the $1950 resistance zone to finish at $1984USD per ounce overnight. This shows the $1930-1950 and not $1900 as the better short term support level and uncle point to re-engage long speculative positions from here:
Glossary of Acronyms and Technical Analysis Terms:
ATR: Average True Range – measures the degree of price volatility averaged over a time period
ATR Support/Resistance: a ratcheting mechanism that follows price below/above a trend, that if breached shows above average volatility
CCI: Commodity Channel Index: a momentum reading that calculates current price away from the statistical mean or “typical” price to indicate overbought (far above the mean) or oversold (far below the mean)
Low/High Moving Average: rolling mean of prices in this case, the low and high for the day/hour which creates a band around the actual price movement
FOMC: Federal Open Market Committee, monthly meeting of Federal Reserve regarding monetary policy (setting interest rates)
BOJ/Abenomics: Bank of Japan, economic policy/direction enacted by PM Shinzo Abe
DOE: US Department of Energy
Uncle Point: or stop loss point, a level at which you’ve clearly been wrong on your position, so cry uncle and get out!