by Chris Becker
The vampire squids are out this weekend at Goldman Sachs with a revised forecast on US economic growth, both for the year (down -4.6% instead of -4.2%) and the rebounding Q3 quarter (up 25% vs 33%) in response to the growing breakout of COVID-19 (aka TrumpFlu aka WTFUSA). In summary, they see a continued rebound this quarter going into the US fall (where the actual flu season will ramp up) and the presidential election in November, but at a reduced rate compared to their last note, and a very optimistic view of a return to normalcy thereafter (nearly 6% annual GDP growth in 2021 and lowered unemployment to only 9%).
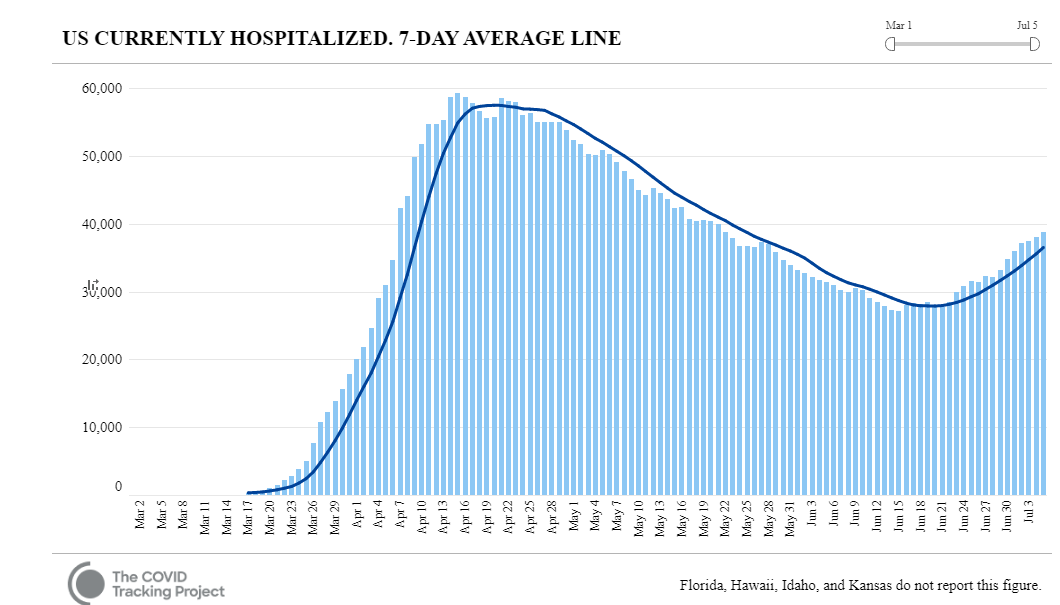
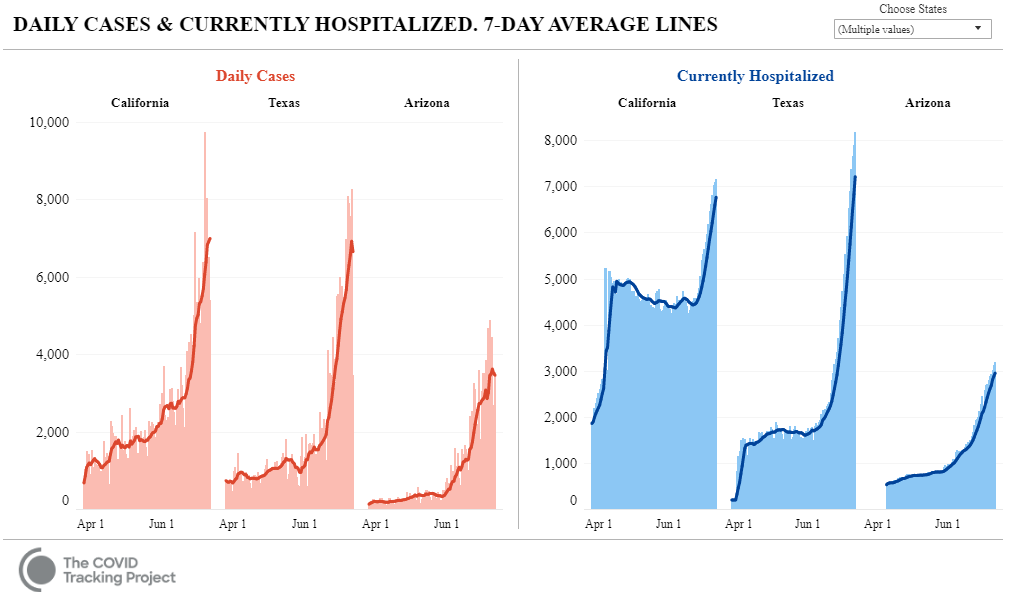
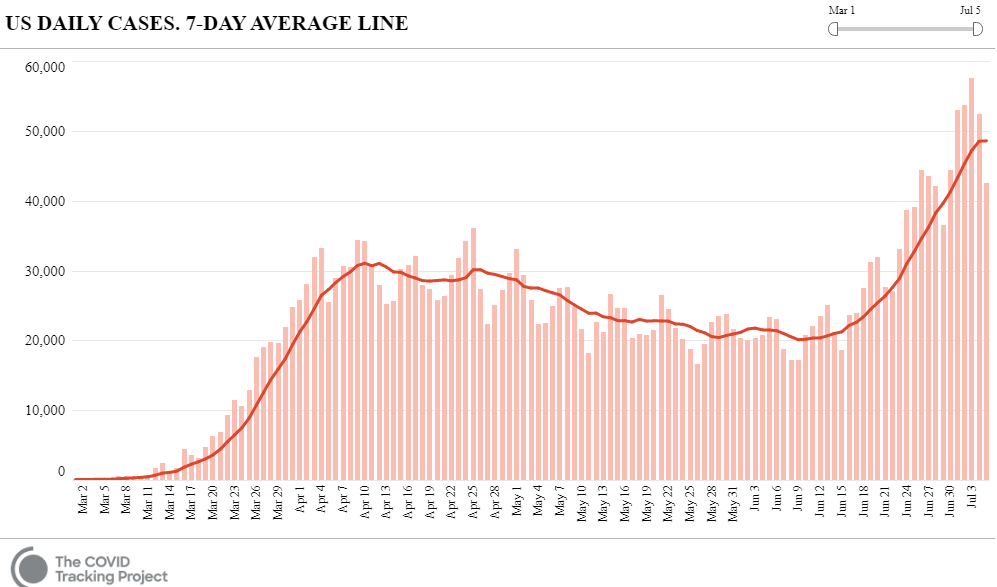
The problem is that predictions are very difficult, especially about the future, and indeed the future trend of the pandemic in the US, with new cases going exponential for the last few weeks in the south and mid-West, now surpassing 50,000 cases per day and on the way to 100K per day according to Dr Fauci. Alarmingly, the positivity of these cases are getting very high even as testing increases, meaning there is a staggering amount of community transmission out there not being included in the numbers:

With several US States now backtracking on their negligent too early opening up, its obvious that economic activity will contract further again, and even more as the backtracking turns into panic mode as they go full “Italian” into the fall flu season, with most hospitals already near capacity throughout the South and Mid-West. More lockdowns loom:

- Macro Morning - January 22, 2021
- Macro Afternoon - January 21, 2021
- Macro Afternoon - January 20, 2021
Hey Chris, why did you leave out the chart showing the number of Americans dying from COVID-19? Or the daily case count adjusted for testing levels? Come on, these are rookie statistics errors.
MB subscribers who want to understand how the US is doing, from someone who actually understands math, will be better served by following @boriquagato on Twitter.
Why do you need an ‘adjustment for testing level’? It is not going to change the number of cases tested positive.
Death will go up when the hospitals are overwhelmed. It’s not there yet, but without another lockdown, it’ll get there.
Further, ‘dying’ often has a 2-6 week lag with infections.
+1 = watch Vic
Are you seriously ask why sample size matters?
US hospitals have never been overwhelmed, not even in NYC at the height of their pandemic.
I don’t think I’d want to use twitter as a reference, thats a rookie mistake.
Even a cursory glance of the literature indicates a probable 4-6 week lag from infection to death, including the CDC saying it takes over a week to actually record the death on the official statistic.
In other words, wait a week or two.
Also the death rate is mainly from the northeast states who were hit first and are now flattening out, with the South and mid-west now catching up…
The IFR is still around 0.5% to 1% (best estimate, again according to the variety of surveys out there, and although this should drop because mainly young people are getting infected, they are then passing that on to the older cohorts), the positivity rate for this new “second” wave of cases is stubbornly high, which statistically speaking is very worrying as it indicates higher community and asymptomatic transmission.
In other words, 50000 new cases per day equates to approx. 250 to 500 more deaths per day (or 15000 per month) added to the 130K death toll – and that assumes a linear response, not exponential as we’ve seen, or any other mitigating factors like an Italian hospital response when triage is enacted, which then pumps up the overall mortality rate. Oh and the flu season.
I’m a risk manager by profession, not an epidemiologist, but they all say this is something to be extremely concerned about.
Or you can just listen to the anonymous folks on twitter I guess and adjust your portfolio as you see fit?
Cute, so you take the blue check mark Twitter WHO account as gospel? The whole point of being anonymous on Twitter is that BS credentials don’t matter. All that matters is the quality and accuracy of your analysis. I’m not seeing anything in your response (or your LinkedIn profile) to indicate that you understand math better than me (Computer Science grad) or anonymous Twitter dude. For MB readers who have studied math in university, here’s a a thread by anonymous Twitter dude who understands statistics that may be of interest to you.
It’s an inconvenient truth. Death numbers not scary enough to ensure hysteria.
Surely only a fraction of stimulus money could have been used to protect the vulnerable to the virus without ship canning the economy?
The world has gone made from hysteria and power tripping.
Doesn’t work. Humans gonna human. Sweden’s economy crashed just like its neighbours did.
it’s interesting to see that despite much larger number of cases and hospitalizations than in Italy, UK or Spain … USA healthcare system is still holding on
That’s because UK, Italy, Spain, France, Belgium etc had higher per capita infection rates.
https://www.statista.com/statistics/1104709/coronavirus-deaths-worldwide-per-million-inhabitants/
Lots of Americans are probably more prepared to take their chances with the WuFlu than bankruptcy.