

By Chris Becker
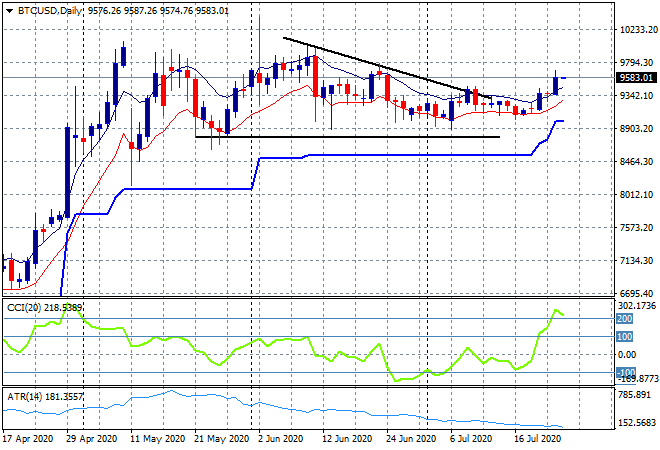
Disappointing US jobs data and the rising US/China tensions, coupled with ridiculous narrowness of US stock advances pulled back Wall Street and European bourses overnight as we head into the end of the trading week. The USD is mixed against some of the majors with stalls on Pound Sterling and Aussie after some major advances through the week, while gold and silver put in new near record highs, with Bitcoin finally showing some signs of life too, making a new monthly high:
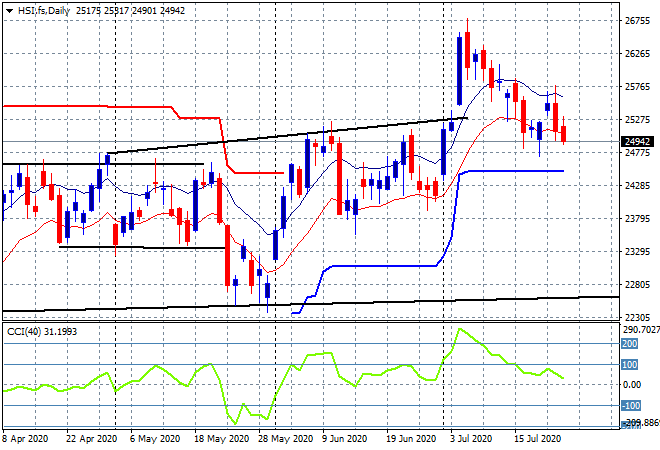
Looking at share markets in Asia from yesterday where t the Shanghai Composite is down 0.3% to 3324 points while in Hong Kong the Hang Seng Index is putting on some mild gains, currently up nearly 0.6% to 25223 points. The daily chart now shows a near full retracement of the bounce off support at the 25000 point barrier, but as I’ve been warning this remains wobbly at best. Watch the low moving average and momentum readings here for signs of a full inversion:
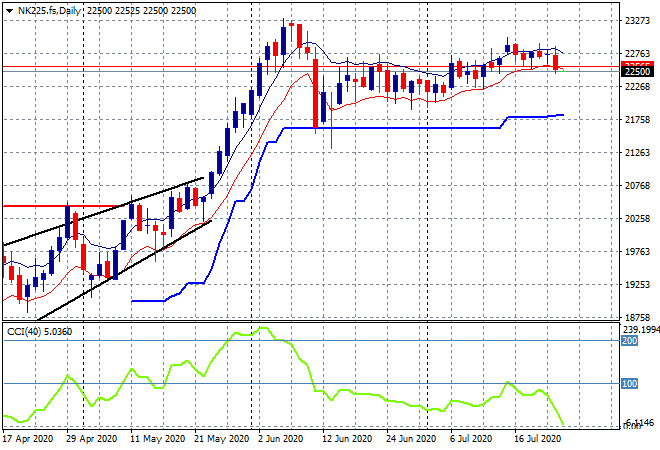
Japanese stocks were closed and will be again today with the Nikkei 225 futures falling back to the 22500 point level overnight. I’ve been contending that buying conviction remained doubtful for awhile now and that the daily price pattern remains tight, indicating some volatility soon:
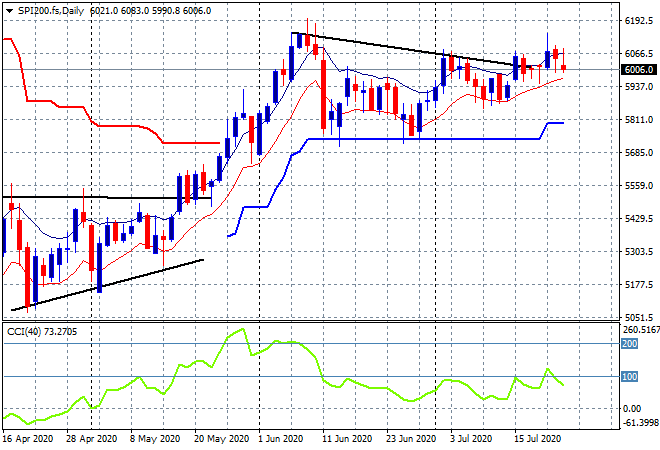
The ASX200 had a modest session, lifting 0.3% to 6094 points by taking back some of the previous losses, but still not being helped by a strong Australian dollar. SPI futures are down over 50 points or nearly 1% so I would expect the 6000 point level to come under threat in today’s session:
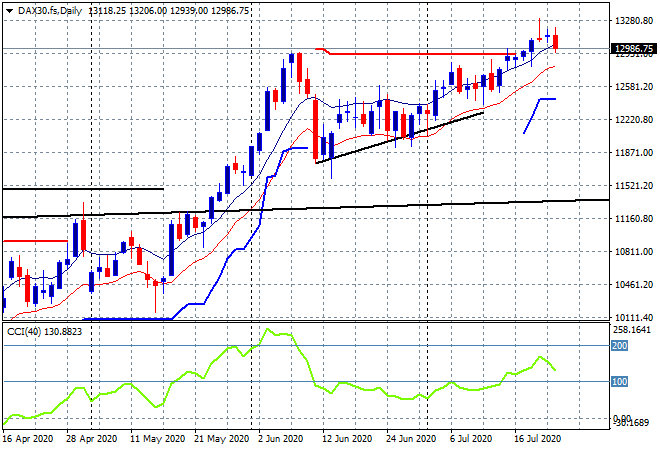
European markets were hesistant again with only the FTSE putting on gains, but barely as the rest of the continent recorded scratch sessions as the hoopla from the EU fiscal sharing package died out. The German DAX finished a handful of points lower to 13103. Futures are showing a retracement back towards the recent breakout area in line with weakness on Wall Street, as I said yesterday price was getting ahead of itself above the high moving average as momentum slowly rolls over:
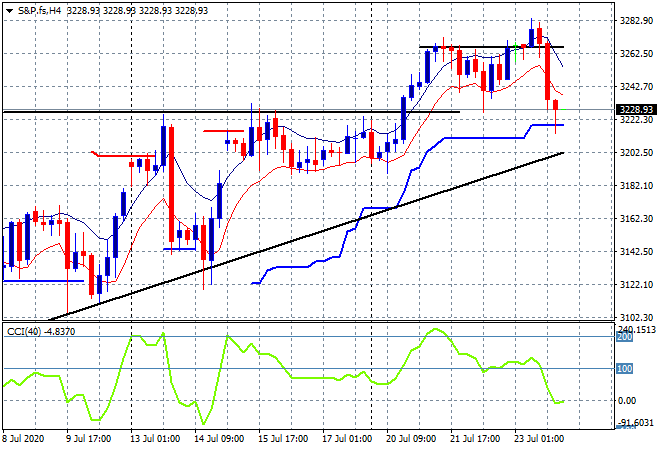
Wall Street had a big slump as the main five stocks pushing the whole edifice higher finally had a mild pullback, pulling back the veil that there’s an actual bear market hiding underneath! The Dow retreated 1.3% while the NASDAQ stumbled over 2%, the “broader” S&P500 a little more than 1% to 3235 points. The four hourly chart shows how price has gravitated back to the previous breakout level just above 3230 points after rejecting strong resistance at the 3275 point area:
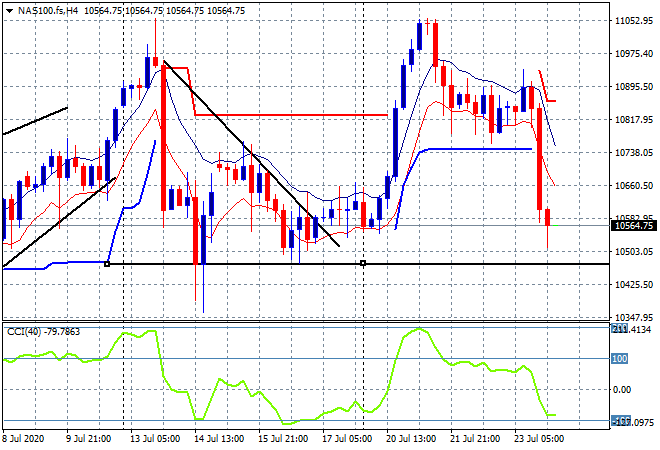
There’s a double top pattern forming here on the four hourly NASDAQ chart as price reverts back to previous support. How long can the five major tech stocks sustain this?
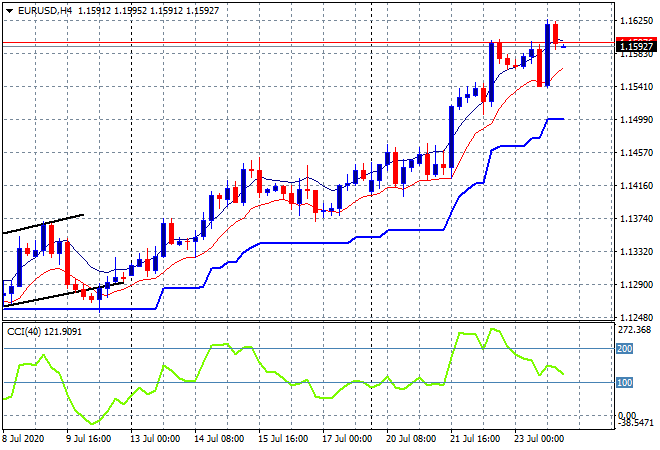
Currency markets remain volatile as the USD bears and bulls continue to battle it out, with Euro oscillating wildly on the initial jobless claims print, pushing through the 1.16 handle overnight and just sticking there this morning. I cautioned how overbought the union currency was, ripe for a pullback, but the warning the anything can open remains open and we see a blowout trend here as everyone dumps USD:
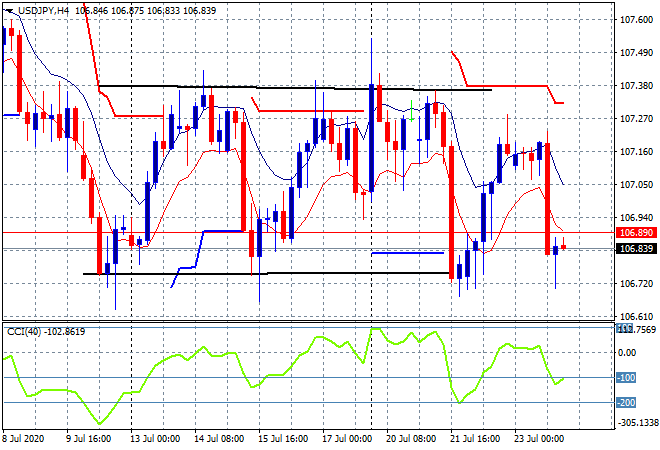
The USDJPY pair was crushed overnight, pushing back to the weekly lows at the 106.70 level which is just holding coming into the Asian session this morning. Momentum had flipped back to positive on the four hourly chart, but this was shortlived with resistance too strong. The key uncle point here is pretty obvious as Yen buyers step in:
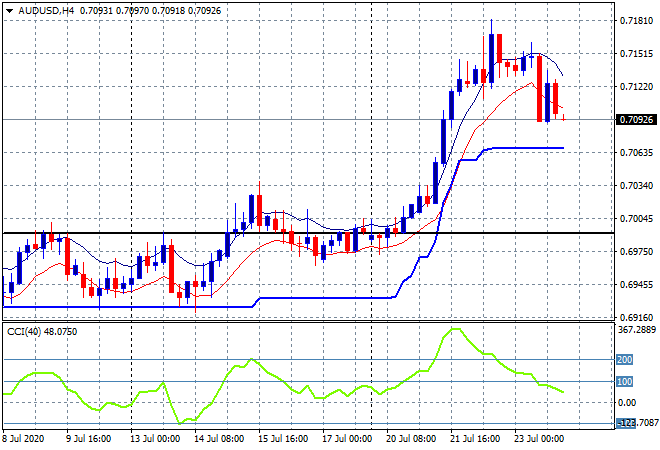
The Australian dollar followed stocks and risk assets, after slowing down previously, now selling off going into the open this morning at just above the 71 handle. As I said yesterday, continue to watch the 71 handle proper here for signs of a reversion but be mindful of support at 71.20 that still looks very firm in the short term:
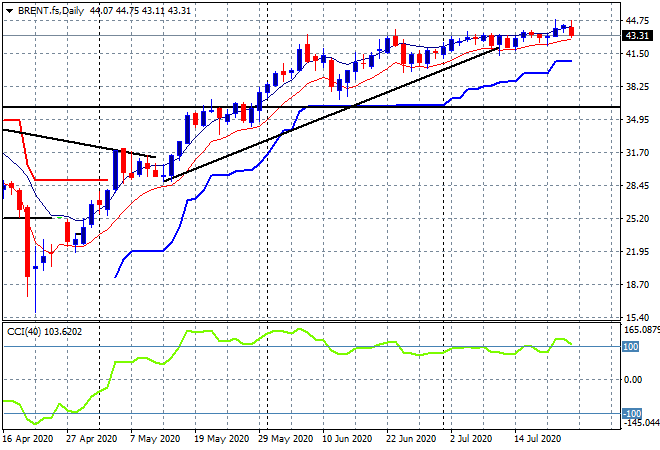
Oil futures fell over 2% overnight in line with risk assets with the Brent market unable to get back near the $44USD per barrel level, closing at just over $43 instead. Daily momentum had been pushed into the overbought mode and support has been very firm, so I’m stilling watch for a big fill once the $44 mark is properly breached:
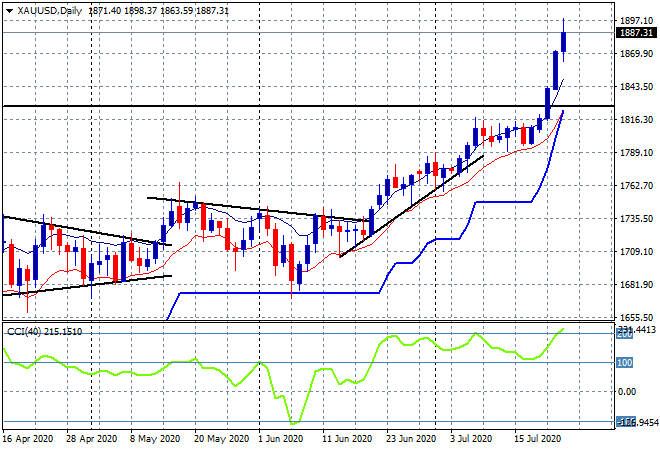
Gold – and silver – continue to make a new daily/weekly/monthly/yearly highs, the former closing at the $1887USD per ounce level in another very strong move overnight that looks completely overblown! This keeps the shiny metal well past the 2011 closing high but not the intrasession record high at $1920 – but I suspect some profit taking along the way:
Glossary of Acronyms and Technical Analysis Terms:
ATR: Average True Range – measures the degree of price volatility averaged over a time period
ATR Support/Resistance: a ratcheting mechanism that follows price below/above a trend, that if breached shows above average volatility
CCI: Commodity Channel Index: a momentum reading that calculates current price away from the statistical mean or “typical” price to indicate overbought (far above the mean) or oversold (far below the mean)
Low/High Moving Average: rolling mean of prices in this case, the low and high for the day/hour which creates a band around the actual price movement
FOMC: Federal Open Market Committee, monthly meeting of Federal Reserve regarding monetary policy (setting interest rates)
BOJ/Abenomics: Bank of Japan, economic policy/direction enacted by PM Shinzo Abe
DOE: US Department of Energy Uncle Point: or stop loss point, a level at which you’ve clearly been wrong on your position, so cry uncle and get out!