

By Chris Becker
Risk sentiment swung wildly again overnight echoing the previous session as the US corporate earnings season got into full swing. While European stocks lagged, Wall Street surged after the latest CPI figures were higher than expected and vaccine news overshadowed continued bad news around COVID-19 cases. Commodities were in a holding pattern, including gold, while the USD swung lower against Euro for a monthly low while the other majors were mixed.
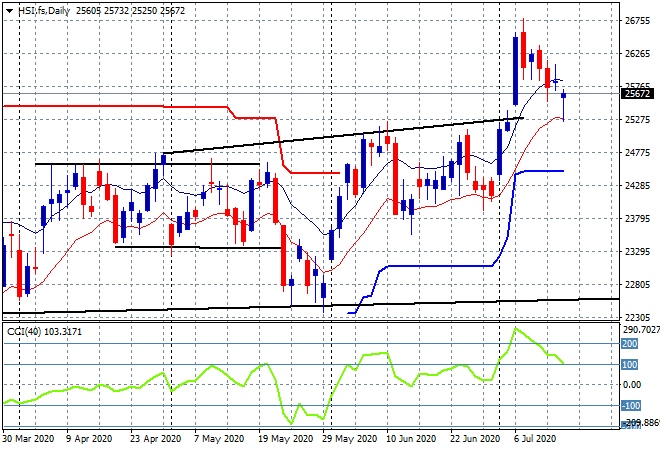
Looking at share markets in Asia from yesterday where the bears were in control for a day, the Shanghai Composite was down nearly 0.9% to close at 3414 points while in Hong Kong the Hang Seng Index was down 1.1% to 25477 points. The daily chart shows price now retracing all of last week’s breakout with momentum readings swinging to a possible short position as support at 25000 points comes under pressure. This looks like a retracement, not an inversion so far:
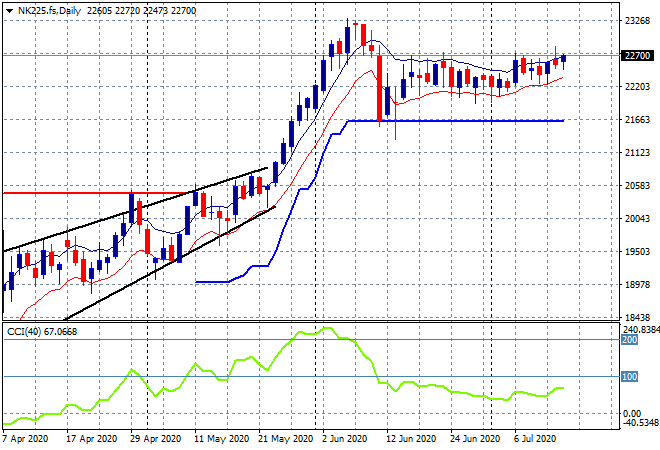
Japanese stocks stumbled after having a good start to the week, with the Nikkei 225 down 0.9% to close at 22587 points. Futures however are lifting higher, pushing up towards the 23000 point level as momentum picks up on the daily chart. Note how the high and low moving average band is starting to push higher here:
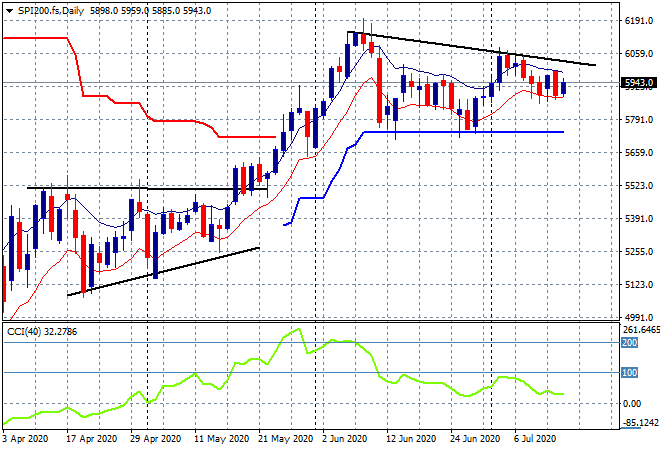
The ASX200 fell at the open and stayed there, moving in lockstep with Wall Street’s previous session to close 0.6% lower to 5941 points. SPI futures are up nearly 50 points however, so most of that will be taken back today as buying support in the medium term remains firm, as does resistance overhead at the 6000 point level:
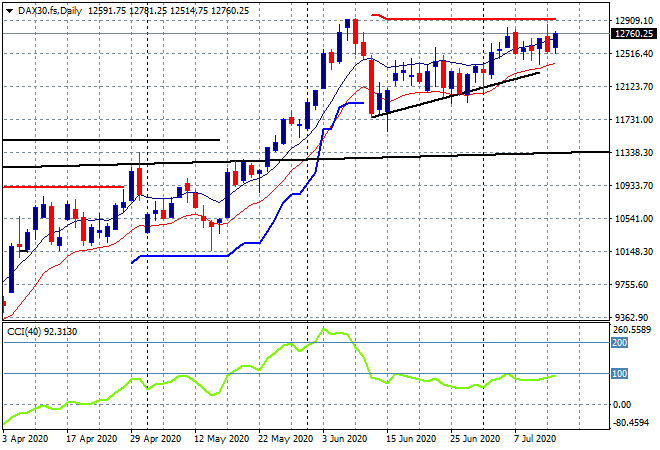
European markets fell sharply at the open, then stabilised as Wall Street opened for only modest falls (the FTSE putting in a scratch session). The German DAX closed 0.8% lower to 12697 points, taking this back in futures thereafter. The daily chart continues to show a steady uptrend from the early June lows and if the actual session later tonight follows futures with a new daily high we could see a retest of the 12900 high soon:
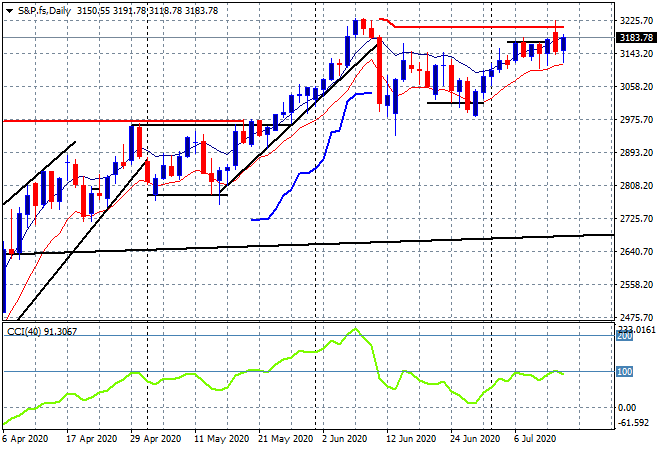
Wall Street was all over the place again, with the Dow soaring 2% on some good earnings reports, while the broader S&P500 lifting over 1% to 3197 points. The daily chart clearly shows building support at the 3100 point level, with the previous session absorbed into this wide trend channel that still has legs to get to the previous nominal highs:
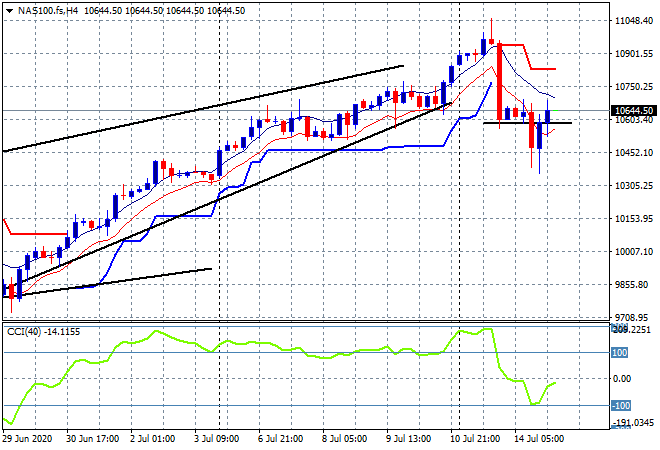
But watch NASDAQ – the four hourly chart shows a break of the rising wedge pattern and a struggle to maintain support here:
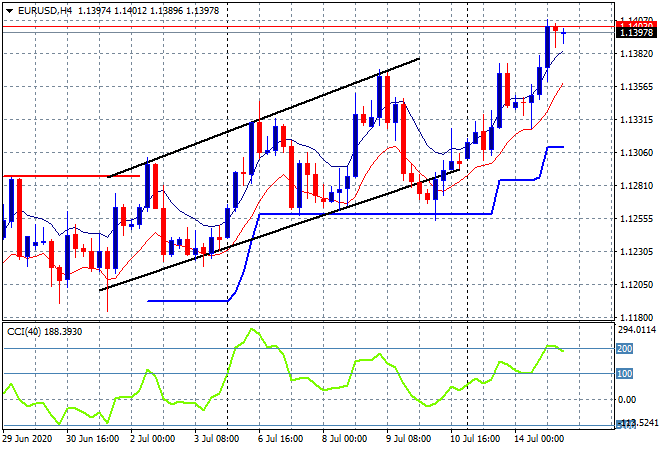
Currency markets continued to enjoy the volatility with Pound Sterling swinging around the 1.25 handle while Euro made a new monthly high to get just above the 1.14 handle before barely retracing here this morning. This has been a swift swing higher, bouncing off the low edge of the trend channel and now nicely overbought and ready for more longs to pile in:
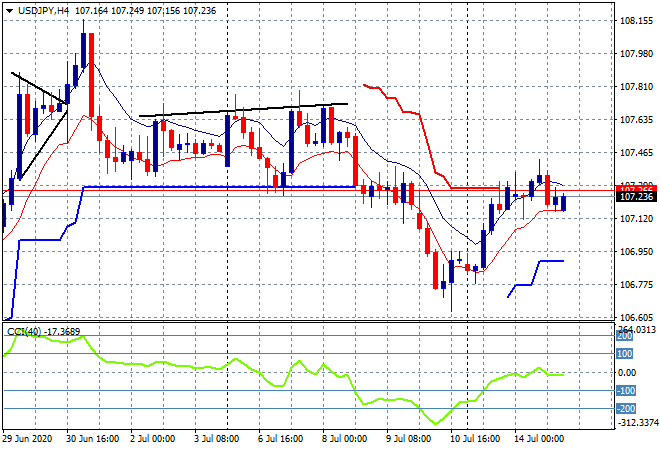
The USDJPY pair was unable to bounceback however, with a small look above on the higher than expected CPI print, but then pushed back below former trailing ATR support as momentum remains flat on the four hourly chart. This keeps the pair at its week long pivot point around the 107.20 level with resistance not yet cleared, I’d be concerned about a sharp reversal down again here:
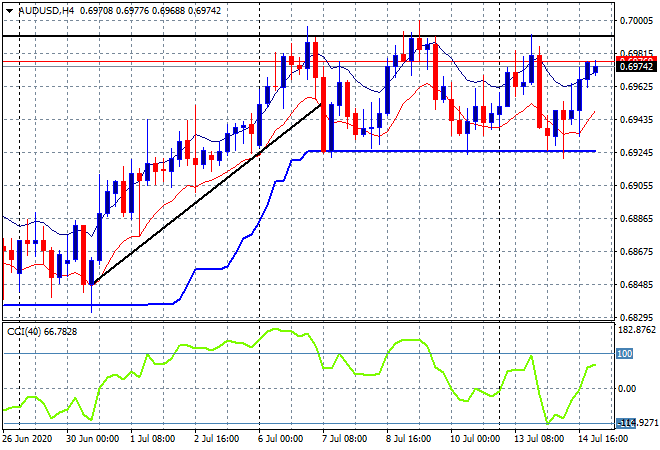
The Australian dollar followed stocks again with a swing higher towards the 70 handle, converting the triple top bearish pattern on the four hourly chart into a consolidation channel. So far ATR support at the 69.20 level has held without a breakdown, despite an inability to clear resistance overhead and a series of lower highs:
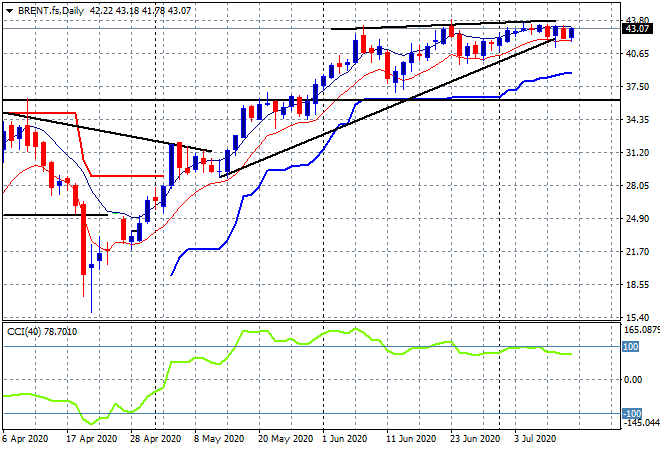
Oil prices regain only a little overnight with Brent futures closing just above the $43USD per barrel level, unable again to make a new daily high. Daily momentum is flat lining here again, with price finding support as it reaches the lower edge of the trendline from the May lows, but still requires a burst through the $44 mark to get going:
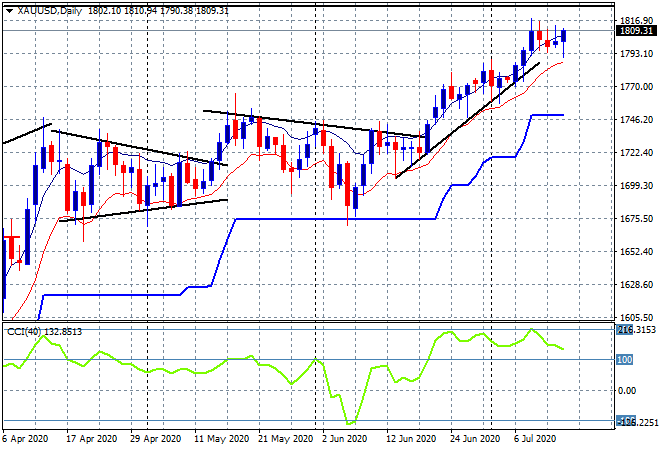
Gold finally found its legs after a worrying few sessions, including a snapback down below the $1800USD per ounce level before a solid rebound to finish at the $1809 level overnight. The next test is matching and then exceeding the $1815 level as the trend gets back on a more sustainable path:
Glossary of Acronyms and Technical Analysis Terms:
ATR: Average True Range – measures the degree of price volatility averaged over a time period
ATR Support/Resistance: a ratcheting mechanism that follows price below/above a trend, that if breached shows above average volatility
CCI: Commodity Channel Index: a momentum reading that calculates current price away from the statistical mean or “typical” price to indicate overbought (far above the mean) or oversold (far below the mean)
Low/High Moving Average: rolling mean of prices in this case, the low and high for the day/hour which creates a band around the actual price movement
FOMC: Federal Open Market Committee, monthly meeting of Federal Reserve regarding monetary policy (setting interest rates)
BOJ/Abenomics: Bank of Japan, economic policy/direction enacted by PM Shinzo Abe
DOE: US Department of Energy Uncle Point: or stop loss point, a level at which you’ve clearly been wrong on your position, so cry uncle and get out!