

By Chris Becker
Another divergence in risk on Friday with Asian share markets having a red session to finish the week, while despite a big surge in COVID-19 cases and deaths in the US, Wall Street pulled a swifty and rocked the risk complex with another solid session. US inflation measures remained soft, helping add to the fervor that the Fed will continue to support markets til the end of time, with the USD little changed, but commodities lifting alongside stocks and unfortunately gold finished below the key $1800USD per ounce level.
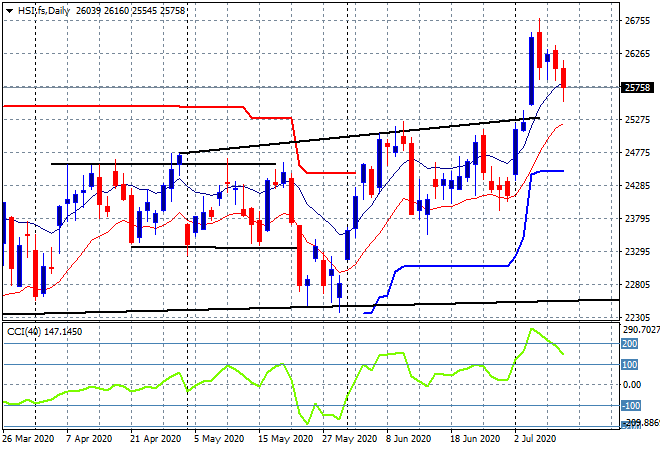
Looking at share markets in Asia from Friday where the Shanghai Composite finished a solid week on a sour note, falling nearly 2% to close at 3383 points. Meanwhile in Hong Kong the Hang Seng Index had similar falls, down 1.8% to 25827 points. The daily chart shows how the big breakout towards 27000 points has led to nothing so far, just a series of retracements and the potential to move back below the previous uptrend line. Support is hard to discern here given the strong moves either way, and requires some stabilisation around the high moving average, keeping the 25300 point intact to have any chance of advancing further:
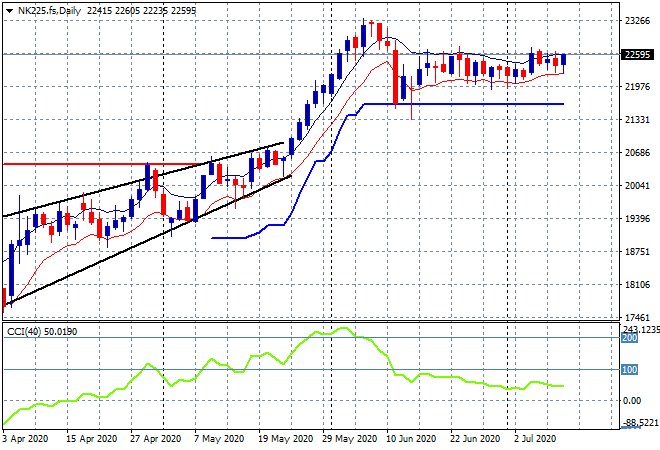
Japanese stocks had a selloff as well with the Nikkei 225 falling just over 1% to 22290 points. Futures are indicating a replacement of that move on the weekend gap open following the positive Wall Street lead. The daily chart remains blocked somewhat, at least on the downside with a sideways but bullish biased trend that could eventuate in a violent move higher here above 23000 points soon:
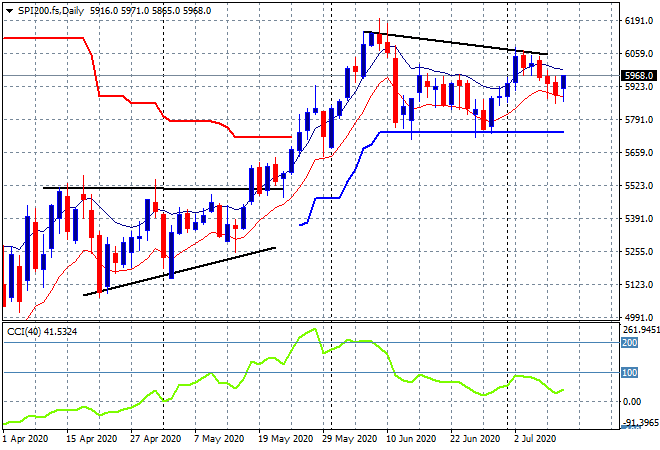
The ASX200 had modest falls, down 0.6% to 5919 points and finishing the week well under that elusive 6000 point barrier. SPI futures are up nearly 100 points in response to the surge on Wall Street, so we’re likely to see a push towards the 6000 point level on the open on Monday. For now the medium term picture is one of modest support and almost no bearish bias and reason to be short, as sentiment outweighs macro and other settings:
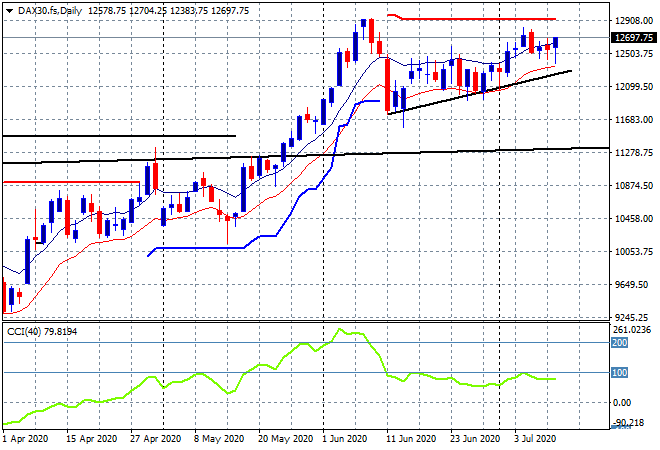
European markets started poorly and pulled back but on the Wall Street open surged, with the German DAX standing out as the best performer, up 1.1% to 12633 points. The daily chart still shows a steady uptrend from the early June lows with this latest supportive move setting up for a retest of the May highs at just below the 13000 point level:
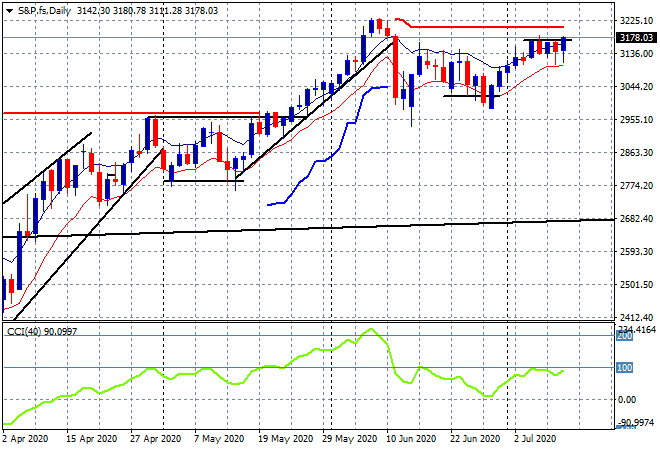
Wall Street can’t be held back although this time the NASDAQ was the relative loser, up only 0.6% while the Dow 30 lifted 1.4% and the broader S&P500 broke out of its funk to finish 1% higher at 3185 points. The daily chart since the Monday open had shown an inability to get back above the 3170 point level (upper solid black line) but as I keep saying, there’s still no reason to be short US stocks yet unless key psychological support at the 3000 point level is solidly closed under:
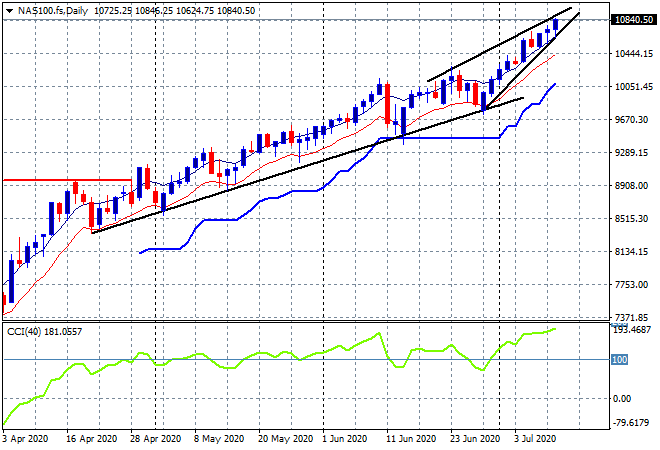
That is not to say we aren’t in a bubble – check out the daily chart of the NASDAQ – a bearish rising wedge as price accelerate off an already steep trendline from the April lows. Hard to catch this one either way, risk management is key as always:
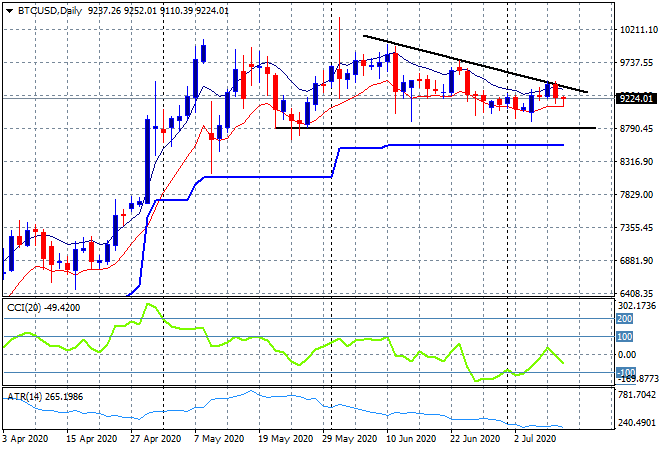
Before we get into the major currencies, a quick look at Bitcoin showing almost no action here since the $10,000 point level was breached in May, with a descending triangle forming and almost completed on the daily chart. Support remains firm at the $8800 level, but momentum is not positive, with ATR falling to low volatility levels – which means there is a large spike in volatility coming:
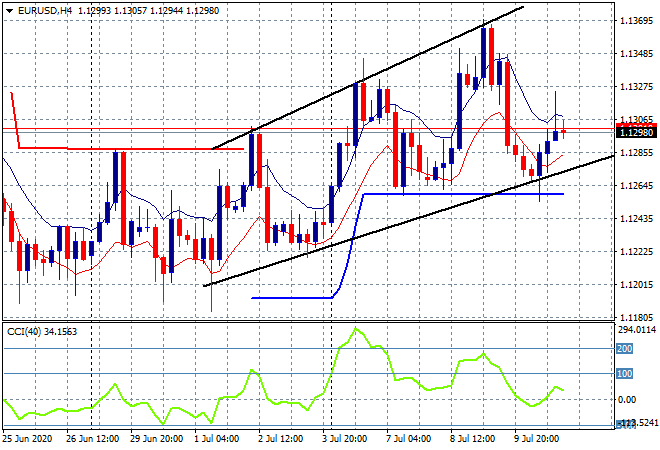
Onto currency markets where it was a flat finish with most majors moving around a relatively tight range. Euro bounced back from its mid week pullback, getting above the 1.13 handle but failed to remain above, but price remains in a good position to swing again on Monday. ATR trailing support at the mid 1.12 level remains firm, with momentum nominally positive on the four hourly level but I’m watching that nascent trend of higher session lows from the start of the month to see if it comes under pressure this week:
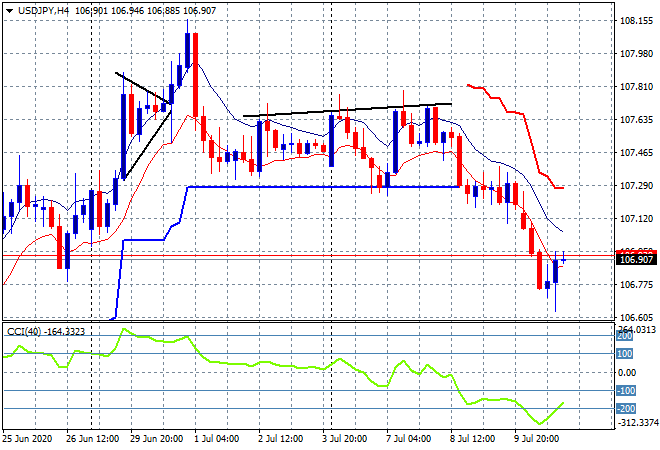
The USDJPY pair continues to fall despite USD strength, still pushing below former trailing ATR support as momentum remains oversold and Yen buyers keep stepping in be just above the 107 handle. Again, today’s action will be illustrative if equity markets don’t stabilise, so watch for a follow through here below the 107.20 level:
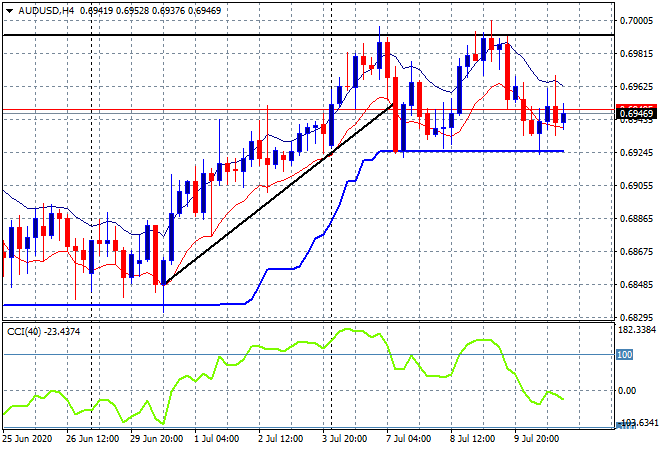
The Australian dollar also followed Euro with a milder move below its recent lows to stabilise at the mid 69 level as USD gained strength against the Pacific Peso. The inability to get above the 70 handle has been an interesting price pattern to watch on the four hourly chart, but so far ATR support at the 69.20 level has held without a breakdown, despite a clear reversion of momentum here to the downside:
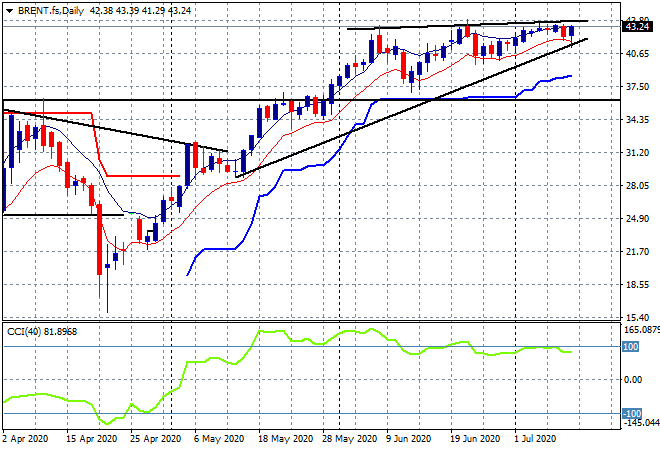
Oil prices found some stability alongside the risk-on trade by finishing the week broadly where it started, with Brent futures closing just above the $43USD per barrel level, able to get back above the previous price highs from this rebound rally. Daily momentum has stopped rolling over, with price finding support as it reaches the lower edge of the trendline from the May lows, but still requires a burst through the $44 mark to get going:
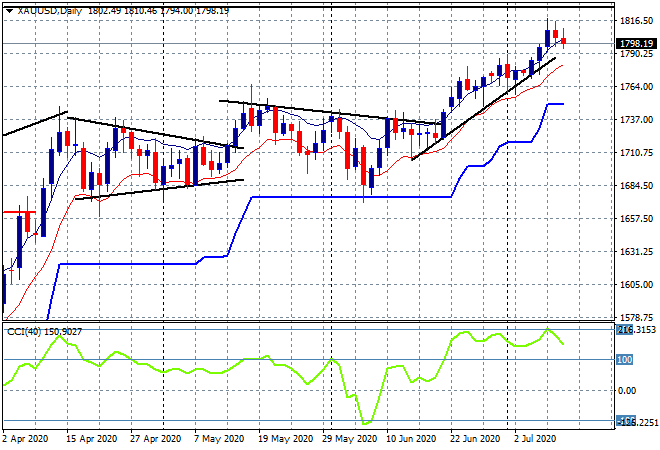
Gold was unable to put in another new daily high, with a mild retreat to finish the week just a smidge below the $1800USD per ounce level. Momentum had been moving towards a more extreme overbought mood here, with price well above its trendline so a minor pullback on profit taking is to be welcomed to make it more sustainable. But don’t discount an all in response as new decade highs are made!
Glossary of Acronyms and Technical Analysis Terms:
ATR: Average True Range – measures the degree of price volatility averaged over a time period
ATR Support/Resistance: a ratcheting mechanism that follows price below/above a trend, that if breached shows above average volatility
CCI: Commodity Channel Index: a momentum reading that calculates current price away from the statistical mean or “typical” price to indicate overbought (far above the mean) or oversold (far below the mean)
Low/High Moving Average: rolling mean of prices in this case, the low and high for the day/hour which creates a band around the actual price movement
FOMC: Federal Open Market Committee, monthly meeting of Federal Reserve regarding monetary policy (setting interest rates)
BOJ/Abenomics: Bank of Japan, economic policy/direction enacted by PM Shinzo Abe
DOE: US Department of Energy Uncle Point: or stop loss point, a level at which you’ve clearly been wrong on your position, so cry uncle and get out!