The ABS has released provisional mortality data, which suggests that COVID-19 has indirectly increased Australia’s mortality rate, primarily by diverting health resources and effort away from other areas:
In the second provisional monthly mortality report released today, the ABS found that between January and April this year there were around 44,000 doctor certified deaths. This compares with an average of 42,500 over the previous five years.
Director of mortality statistics at the ABS, James Eynstone-Hinkins said: “The number of deaths between 18 March and 14 April were particularly high, exceeding historic averages by more than 700. The number of deaths then decreased through the remainder of April.”
Deaths from pneumonia were high compared to historic averages from mid-March to mid-April before decreasing towards the end of April. Diabetes deaths were also higher than expected, and remained high through April.
“This sustained increase in diabetes deaths highlights the importance of patients continuing to manage chronic health conditions with their doctor during the course of the pandemic”, Mr Eynstone-Hinkins said…
Tracking the number of doctor certified deaths against historic averages provides an indication of when excess deaths may occur. In 2020, this is of particular relevance because of the many potential public health impacts of the COVID-19 pandemic.
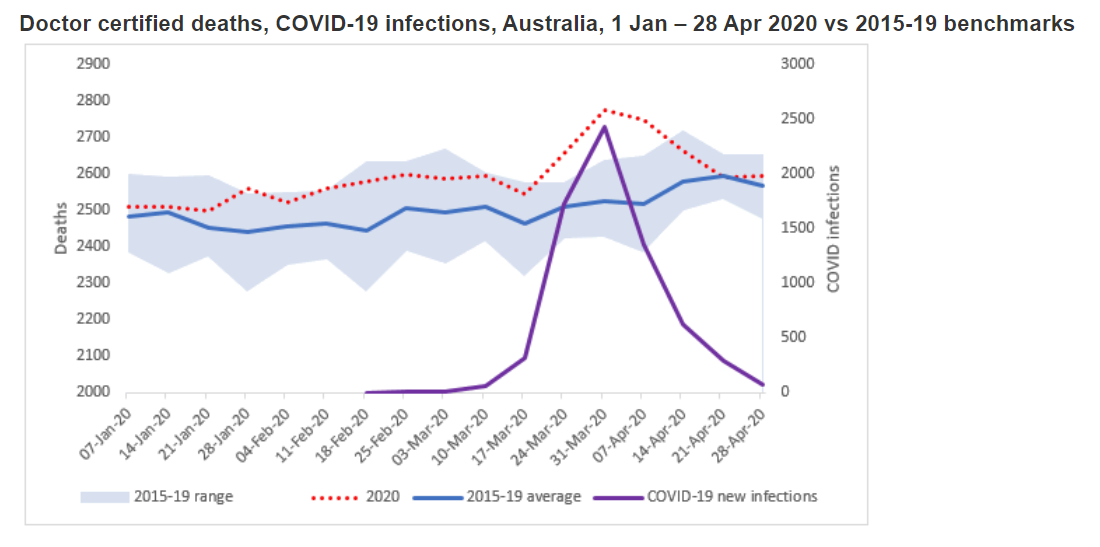
The number of COVID-19 infections by week in Australia is highlighted alongside total deaths to enable a comparison of the timelines for the pandemic with changes in numbers of deaths. Over the period to end-April, peak numbers of COVID-19 infections in Australia occurred in the four weeks from 18 March to 14 April. These weeks are therefore of particular interest in mortality analysis. Changes in patterns of mortality beyond those four weeks also provide insights into the delayed effect of COVID-19 infections (including for the small proportion of people who died from COVID-19) and other indirect effects of measures in place to reduce infections (i.e. the temporary cessation of elective surgery, changes in access arrangements for medical services).
44,079 doctor certified deaths occurred between 1 January 2020 and 28 April 2020 and were registered by 31 May. This compares to a baseline average of 42,507 over the past 5 years.
Over the four weeks from 18 March to 14 April there were a total of 10,842 deaths, 709 more than the historic average for 2015-19.
Counts of deaths over the last two weeks of April were closer to historic averages, although these counts will increase as additional registrations are finalised and reported next month. This will also be the case for most causes of death…
The graph below shows the number of provisional doctor certified deaths that occurred on a weekly basis in the four months of 2020 (red dotted line). A baseline representing the average of 2015-2019 deaths for the same period is also shown (solid blue line). The minimum and maximum range of deaths that occurred in this same period is shown as a shaded outline. A dark purple line represents the number of COVID-19 infections in Australia during the time period. The graph shows the number of deaths is above the 5 year average for all weeks other than the week ending 21 April when it was slightly below. In the week ending 28 January and the weeks ending 24 March, 31 March and 7 April, the number of deaths was above the maximum range. The graph shows that the peak number of COVID-19 infections during this time period occurred in the week ending 31 March and coincided with the peak number of deaths for the same period. Data for mortality presented in this graph are available in the data cube in the downloads tab of this publication.
Leith van Onselen is Chief Economist at the MB Fund and MB Super. He is also a co-founder of MacroBusiness.
Leith has previously worked at the Australian Treasury, Victorian Treasury and Goldman Sachs.