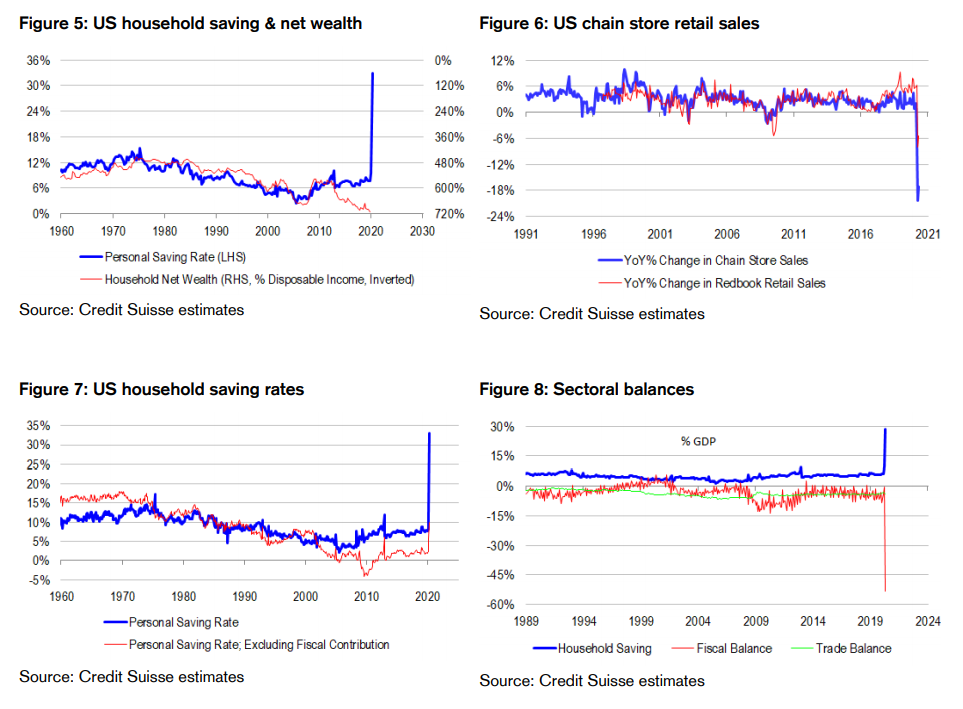
US household saving rate at 33%! A lot happened in April. There was a very sharp downtun in the labour market, households received an enormous boost to disposable incomes from fiscal stimulus, and consumers significantly pared back their spending amid shutdown restrictions. The net balance of these forces was extremely positive for the household saving rate, driving it to an historically high level of 33% of disposable income. There was extraordinary de-leveraging pressure, and overwhelming stimulus occuring all at the same time.
Many different ways to frame what happens next. From such an extreme starting point, economists will pursue many different angles for explaining the dynamics at work, as well as the potential recovery paths. Some will suggest that households had to save in April, because shops were not open for them to frequent. Therefore, when the economy re-opens, the saving rate should fall sharply and consumption should rebound sharply. Others will say that the government printed money through large scale deficit spending, forcing cash upon the system, in the first instance via households. Therefore, the most pertinent questions revolve around the sustainability of stimulus, and which sectors might benefit from the cash injection next, when the parcel gets passed on. More bearish commentators will argue that households simply chose to save more because of precautionary motives in a deteriorating macro environment. These commentators will need convincing that financial conditons are unambiguously getting easier before being satisfied that the saving rate will fall. For what it is worth, we think that the saving rate will fall, because it is significantly overshooting fundamentals. Therefore, consumer spending is likely to recover. Indeed, high frequency data suggests that consumer spending already is recovering, and world growth momentum with it. All of this will ultimately benefit the corporate sector. But we do not think that the data give us clear answers about discretionary versus forced saving, because very major revisions are likely in the coming months given the extraordinary shifts at work. For example, the April personal income report suggests that the increase in household saving is over and above fiscal stimulus – but Treasury spending data suggests that the budget deficit in April exceeds household saving by a considerable margin. Also, the longer-term outlook is particularly cloudy, because fiscal stimulus is so lumpy, and there are question marks about how quickly inflation pressure might return.
The bigger asset allocation picture. There are even bigger questions to answer than what happens to the US consumer from here. To be sure, the US consumer is the buyer of last resort of goods and services globally, and therefore is a powerful driver of the world output. And many asset allocators closely follow the “tea leaves” of US retail sales and world industrial production (IP) to guess where risk appetite might go next with a view to determining the balance of cyclical versus defensive assets within their portfolios. But there are other approaches to consider too. For example, advocates of Modern Monetary Theory (MMT), the Kalecki equation and stock-flow consistency (SFC) will look at how the primary sources of money supply – bank loans, fiscal deficits and unconventional central bank balance sheet expansion – are evolving, and use national accounting identities to judge which sectors in the economy will receive the largest share of the money being created at any given point in time. On the other hand, conventional central bankers will focus on inflation, using models based on perfect competition, cost mark up pricing, and the output gap to determine where interest rates need to go next, before shifting their focus to the state of financial markets. The longer-term approach is based on “through-the-cycle” valuation and expected returns. If it is always the same uncertain future we are buying, the primary determinant of future returns should simply be the valuation starting point, appropriately defined to abstract from short-term cyclical influences. For advocates of this approach, the short-term direction of the US consumer and the sectoral balance analysis of MMT advocates take the back seats, while the inflation outlook in long-term bonds gains primacy, because all that matters is the relative outlook for expected returns across competing asset classes. Clearly, no single approach has all the answers we are looking for across all investment horizons – but a synthesis of approaches should yield some very powerful and interesting insights, both tactically and strategically.
Mean reversion could take a while. History tells us that the single best “through-the-cycle” valuation measure for US equities is the ratio of non-financial market capitalization to GDP. It is like a price-to-revenue measure, combining price-to-spot earnings with today’s profit margin to gauge valuation. Effectively, super-normal profit margins are penalized on this metric as higher valuation. Price-to-earnings and profit margins are both mean reverting series in the long run – and two mean reverting series ought to be more reliable than one! Reflecting this logic, the ratio of non-financial market capitalization-to-GDP is extremely negative correlated with future 10-year equity returns and has greater predictive power than any other valuation measure we can find over the past century. The valuation measure abstracts sufficiently from the cyclicality embedded in today’s profit margins to become “through-the-cycle”, and best harnesses the power of mean reversion. Right now, it points to slightly negative 10-year returns on equities compared with 0.65% returns on offer with 10-year bonds. Therefore the 10-year equity risk premium is negative. Also, central bank models of the term risk premium suggest that bonds themselves are about 85bps rich in yield compared with the long-term neutral cash rate – and this despite concerns about the cycle, dovish central bank forward guidance and quantitative easing (QE). Both term and equity risk premia are negative. Everything could sell off together if mean reversion were allowed to take hold! But mean reversion is not likely near term. In the first place, QE is likely to suppress bond yields for a bit longer. Secondly, the assumption that profit margins will normalize from currently elevated levels, undermining the attractiveness of equities, is not strictly correct. As the national accounting identity tells us, the sum of saving across sectors must equal zero. That is, the sum of household, corporate, government and foreign saving must equal zero at any given point in time. Re-arranging this identity, corporate saving must equal the trade balance plus fiscal deficit, less household saving. And the latest April data suggest that the net balance of these elements is on the rise. Fiscal deficit spending, initially on “overdraft-like” terms with the Fed, is overwhelming both household saving and the trade balance, even though the household saving rate is rising sharply, and the trade deficit is widening. The deposits being created by fiscal deficits need to show up somewhere in the system, and even with households saving an extraordinary amount today, there is still enough cash injection for some of it to spillover to the other sectors. Further, households could easily dis-save at some point, transfering their saving accumulated today to another sector tomorrow. Therefore, it is inevitable that corporate saving will rise. Corporate profits should be increasing too, mathematically if capex is not falling too sharply. Putting the links in the chain together, overwhelming fiscal stimulus is likely to inflate the profit share of GDP, or profit margins in the near term, delaying mean reversion in equities, and making them look more attractive to short-term investors than long-term investors. But long-term investors and bears will argue that the boost to profits from fiscal stimulus could be quite short lived, because fiscal stimulus is currently at emergency levels that are unlikely to be sustained. Bulls will counter by saying that all that matters is that optionality to spend at emergency levels, as demonstrated recently.
Seemingly no better time to “Make America Great Again”. As it turns out, we do not need to know all the moving parts to the sectoral balances to be able to make projections about corporate profits. History tells us that the fiscal deficit less household saving is a good enough proxy for profits. Indeed, the spread is a powerful leading indicator of profits across many periods of time. In part this is because the US consumer and government are the biggest influences of the cycle. But more fundamentally, the correlation should and does tend to work well when movements in the trade balance and corporate investment offset each other. Right now, the spread between the fiscal deficit and household saving points to a very sharp increase in corporate profits over the next year, leaving aside question marks about sustainability for a moment. And should households dis-save while fiscal stimulus is present, corporate profits should increase even more. In the circumstances, if the Trump administration can simultaneously lift the trade balance (or more precisely shrink the deficit), and increase corporate investment, it can deliver an even bigger boost to profits mathematically. In other words, the incentives for protectionist policies and the retaking of production facilities from abroad are very strong. To be sure, there could be negative consequences for USD liquidity abroad, because if the US is a smaller net importer of goods and services from abroad it is also a smaller net exporter of USDs to pay for them. And there are a lot of countries and entities in the world dependent on USD funding, directly or indirectly. But then again, the Fed is offering to supply almost all the world’s USD liquidity requirements at the moment via foreign exchange (FX) swap lines and special repo facilities. So the incentives to pursue “Make America Great Again” protectionist policies have never been greater!
Tension between “sectoral balance” and “means of production” approaches. MMT combined with the sectoral balances makes it very clear that corporate profits as a share of GDP are likely to rise, whether because of the enormity of fiscal stimulus, eventual household dis-saving, or both. But there is a another way to cut the national accounts – according to the split of incomes across the means of production. We can divide GDP into labour, profit and capital consumption shares. When we do this, we arrive at a slightly different picture that needs to be reconciled with the one presented by the sectoral balances. We observe in the 1Q national accounts data a rise in the the labour share of GDP and a fall in the profit share – and all of this despite a sizeable uptick in the unemployment rate and labour market slack. Looking ahead, it is distinctly possible that we could see more of the same dynamics. To see this, note that mathematically, the labour share of GDP is equivalent to real unit labour costs – or the cost of labour per unit of output after adjusting for the overall level of prices in the economy. Going one step further, unit labour costs are equivalent to wages – labour costs per worker – divided by productivity – output generated per hour worked. According to the Atlanta Fed’s wage tracker, which controls for compositional shifts in the workforce, wage inflation is running at a 3-4% annualized pace, even though the unemployment rate is at generational highs. Americans are not taking pay cuts, despite weak labour market conditions and extraordinary competition for jobs! Also, our proprietary productivity tracker, based on consumption (the lion’s share of GDP), private sector aggregate hours worked, and business survey measures of output and employment, is pointing to trend productivity growth below -2%, with consumption falling at a slower pace than hours worked and business surveys reporting that production levels are falling faster than hiring intentions. If this “now-cast” materializes, the economy will experience its weakest productivity growth in recorded history. In the circumstances, nominal unit labour cost inflation could easily pick up to 5-6%. At the same time, CPI inflation is currently running below 2%. Therefore, real unit labour costs and the labour share of GDP are rising strongly, putting downward pressure on the profit share of GDP. Clearly, there is a tension to resolve between “means of production” and “sectoral balance” perspectives on the economy, with inflaton as a key swing factor. Only if inflation picks up materially, can we get both higher unit labour cost inflation and a higher profit share of GDP at the same time.
Inflation is a big complication. Regardess of how we reconcile the different approaches to decomposing the national accounts, it is clear to us that inflation and inflation uncertainty are high. Traditional central bank models of CPI inflation take a competitive, “cost mark up” approach. That is, they assume that in the long-run, profit margins mean-revert to a basic level, such that CPI converges to the sum of underlying input costs. The major cost determinants of CPI are unit labour costs and import prices. With unit labour cost inflation accelerating on rising wages and declining productivity, and with the Fed succeeding in weakening the USD contributing to higher oil and import prices, all of the cost drivers of CPI are now pointing to a noticeable pick up in measured inflation. But then we also need to relax the assumption of perfect competition, and allow for profit margins to vary with the cycle. The reality is that firms are likely to have a degree of pricing power given extraordinary stimulus, supply side disruption from protectionism and COVID-19, and even supply side destruction from permanent business competitor closures. Certainly, MMT and sectoral balances would suggest that profit margins can expand in the circumstances. Therefore, the risk is that CPI inflation picks up by a lot more than traditional models would suggest in this cycle.
Inflation is a limiting factor. We are in an environment characterized by incredibly high inflation uncertainty. Part of the reason for this uncertainty is that the output gap – the key driver of inflation in classical models – is in an extraordinary state of flux amid deep recession, lost production capacity from permanent business closures, protectionism, and the kick to demand from fiscal stimulus. Therefore, it is difficult to gauge wage bargaining power and corporate pricing power, let alone the balance between the two. Indeed some might even argue that the output gap may not even be a meaningful quantity right now, given the extreme movements we are seeing in the real economy, effectively breaking the models of the “Great Moderation” era. Never mind whether one is fundamentally an “inflationista” or “deflationista” – “hawk” or “dove” – the issue is that the error bands surrounding any forecast are high. And from an asset allocation perspective, we require adequate compensation for inflation risk. Indeed, central banks have credibility issues to deal with should inflation start to look like it will break higher. It will not be so easy for them to pursue policies suppressing rates and volatility for longer. The threat of inflation forces difficult choices, in contrast to the experience of past decade when inflation rarely threatened and policy makers had few constraints on their efforts to boost growth and markets. The problem is that investors have become wedded to central bank and fiscal policy maker puts at just the wrong time, meaning they could be very easily wrong-footed in the present despite the longer-term nature of the inflation risks at hand.
Alternative risk premia help us to position for complexity. At an asset allocation level, we like commodities as hedges against inflation risk. On the flipside, we are not very keen on bonds and related exposures. But we understand that many investors will not feel comfortable taking an outright view on where inflation heads next. Indeed, it is a “hard sell” to pursue commodites over bonds on the risk of inflation, rather than the actuality of it. And many investors are of the view that the deep recession we are in contributes to an extended period of disinflation. Against this backdrop, we find factor investing incredibly helpful. Momentum, or trend-following factors are pursuing defensives over cyclicals – a position supported by recent decline in corporate profits. But the risks are here that profits surge higher on overwhelming fiscal stimulus, wrong footing the trend followers. Accordingly, we are short momentum. Even so, we cannot completely ignore the need for quality or defensiveness, because stimulus might not be sustained, there are risks of policy errors, and there are valuation risks to consider over and above earnings risks, especially in such an uncertain inflation environment. Therefore, we are long quality, but not long the more crowded names currently favoured by momentum factors. Finally, we are sceptical about value, because if one or more asset price bubble bursts, whether by choice or by force, the risk is that de-leveraging pressures resurface. And in de-leveraging environments, asset prices drive fundamentals, rather than the other way around, undermining the efficacy of anchoring, or mean reversion strategies like value. Overall, our factor portfolio reflects a compromise of very divergent positions, in turn reflecting an incredibly complex set of scenarios to position for. To some, it might look like a “glass half full”, contrarian and cyclical portfolio. To others, it might look as if we are positioning against the system by shorting both momentum and value – the two factors that have worked so well for many decades! Our point is that we do not need to have firm views about the world to make money in such a fluid environment. Factors help us to position for the risks we can identify, provided that we can dynamically weight them. For what it is worth, our factor rotation portfolio is generating alpha in 2020 and is outperforming “plain vanilla” quantitative processes that do not have the flexibility or track record to time factors. Also, we think it noteworthy that our preferred factor combination is favouring larger resources stocks in the ASX 100, supporting our asset allocation thesis about inflation risks.
The full text of this article is available to MacroBusiness subscribers
David Llewellyn-Smith is Chief Strategist at the MB Fund and MB Super. David is the founding publisher and editor of MacroBusiness and was the founding publisher and global economy editor of The Diplomat, the Asia Pacific’s leading geo-politics and economics portal.
He is also a former gold trader and economic commentator at The Sydney Morning Herald, The Age, the ABC and Business Spectator. He is the co-author of The Great Crash of 2008 with Ross Garnaut and was the editor of the second Garnaut Climate Change Review.