

By Chris Becker
Exuberance is exceeding expectations across the risk complex as a swathe of economic activity data overnight pointing to a turnaround in nearly virus free Europe excited stock markets and other risk assets the world over, with tech stocks leading the orgy of buying. Forgotten was the reality of geometric progression of the corona-virus in emerging countries like India, Brazil, Indonesia and of course, in the neo-confederate United States. Commodities fell back unexpectedly on the news, although gold continues to shine, while the USD also continued its own partial retreat.
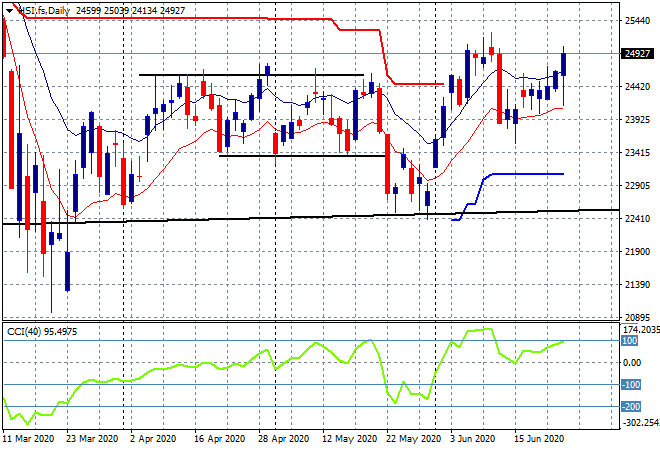
Looking at share markets in Asia from yesterday where the Shanghai Composite was off several points mid trade before coming back with a scratch session to finish at 2970 points while the Hang Seng Index finished 1.6% higher to take back all of its previous losses and then some to 24930 points, finally gaining some traction out of its sideways trend with positive momentum building. Price is nearly matching the former daily highs and is ready for a stage two breakout here with solid support just below 24000 acting as a good uncle point:
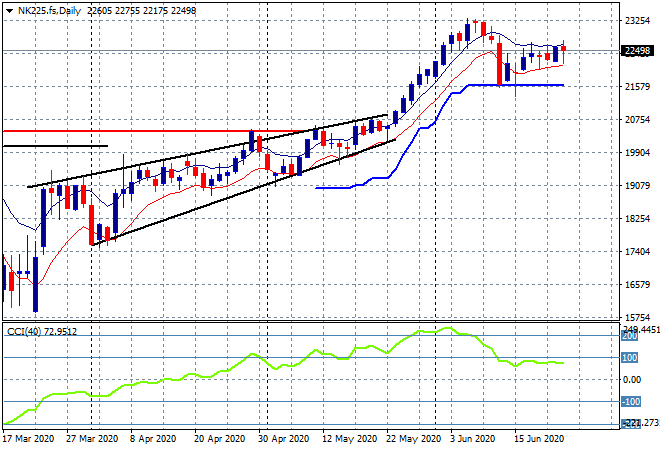
Japanese share markets were up in a solid session with the Nikkei 225 finishing 0.5% higher to 22549 points. Futures are indicating a slight pullback as daily ATR support at the 21500 point level remains firm but this still requires a proper new daily high soon or support may slip:
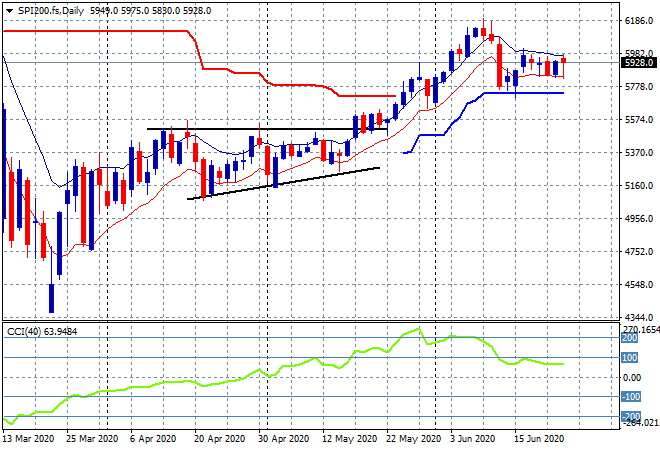
The ASX200 started well enough, up nearly 0.5% at the start of the session before a mild selloff saw it finish barely up at the close, finishing at 5954 points. SPI futures are up only 10 points or so going into this morning’s open despite the very positive Wall Street result, as hesitation continues to hold back price wanting to get back above the 6000 point level again as momentum flat lines here:
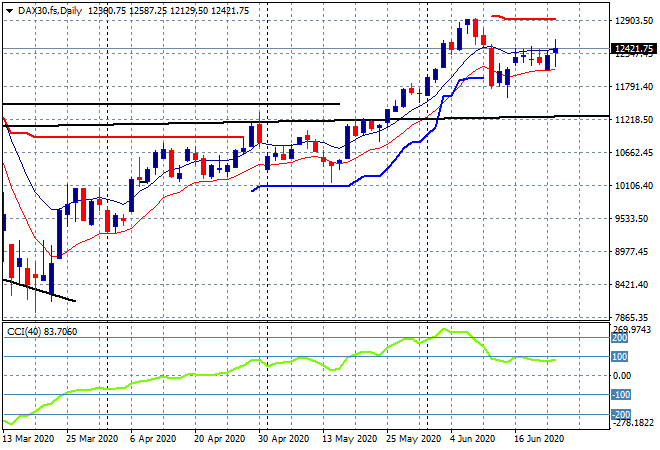
European markets had the biggest surges across the board as the PMI data surprised to the upside (although still in contraction mode) with the German DAX closing 2.1% higher to 12523 points, this was pulled back in post close futures as Wall Street waned towards the end. Overhead resistance at the recent daily highs/high moving average is almost clear here and ready for another attempt at the bubble highs at the start of June, but better get moving or we might see a sharp retracement below 12000 points:
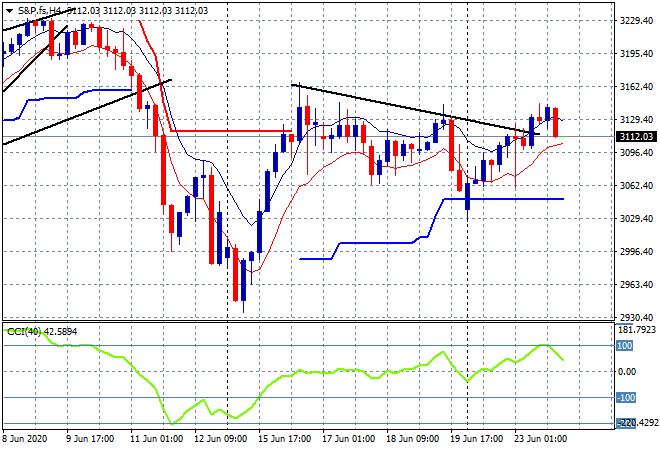
Wall Street is being led by a thin stretch of headline tech stocks with the NASDAQ up to another record high while the S&P500 eventually closed 0.4% higher to 3131 points. The four hourly chart remains illustrative, with the downtrend of lower highs from last week’s intrasession high finally breached, but then pulled back late in the session as momentum inverted. This is a messy chart with the daily no better, stuck between a wide band of support and resistance, so don’t get cocky just yet:
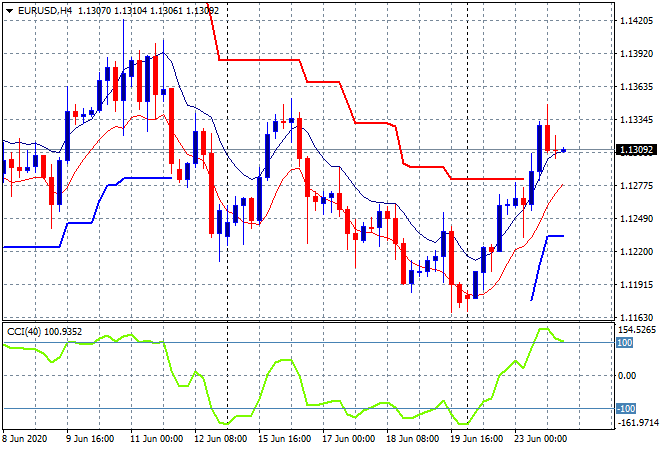
Onto currency markets where the USD selling continued as Euro launched up through the 1.13 handle, well above the nearly week long downtrend before some calm relented and the union currency returned to a more modest overbought status. This has the hallmarks of a new medium term uptrend so watch for continued price action to hug the high moving average and for momentum to remain upbeat:
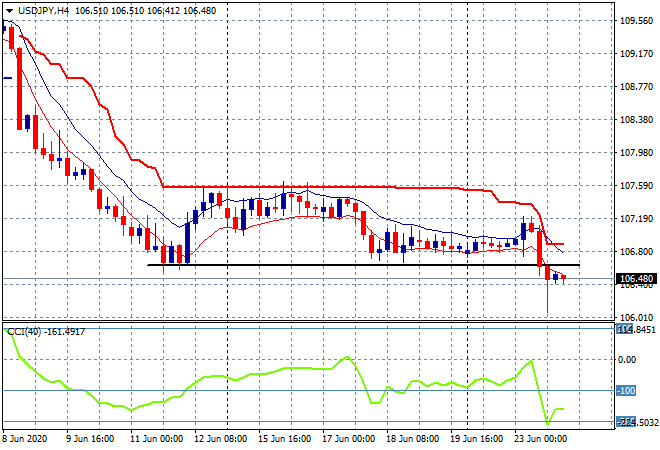
The USDJPY pair had a volatile 24 hours provoking lots of opportunity with a stalled breakout above the recent tight session highs before flummoxing through the long held weekly low at the 106.50 level and almost below the 106 handle itself. This puts in place another down leg and possibly presages the inversion of other risk markets as safe haven buying in Yen builds pace:
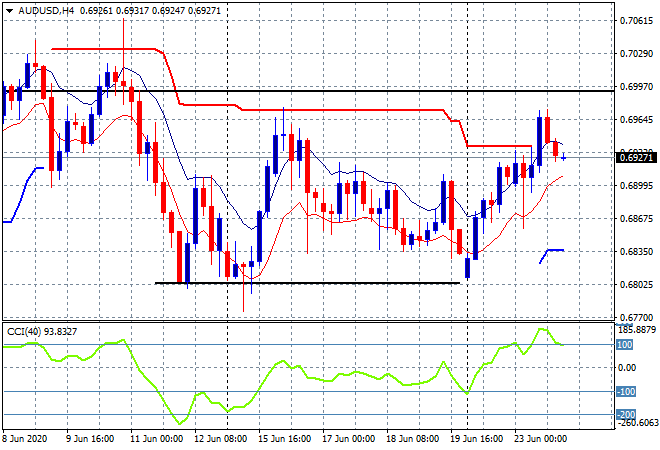
The Australian dollar also joined in with Euro with a similar four hourly chart pattern, breaking above medium term ATR resistance and getting ahead of itself before retracing to the 69 handle this morning. Its not out of the woods yet despite the rise above the 69 handle with last week’s high at the 69.60 level the area to beat before calling this a new uptrend:
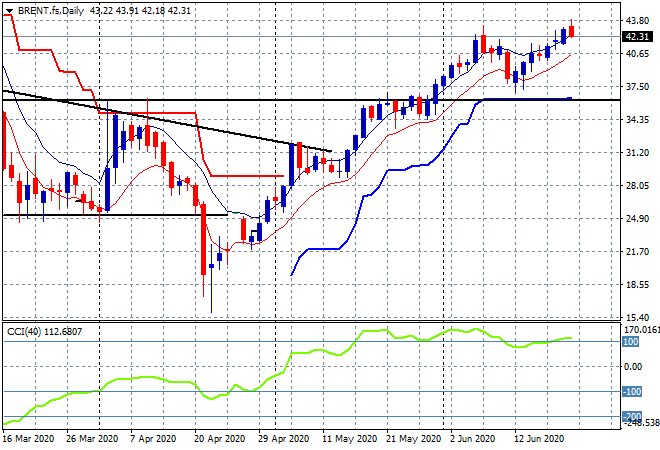
Oil prices want to continue to lift but pulled back in kind with other commodities with Brent futures falling back to just above the $42USD per barrel level. Price had been pushed into overbought mode on the daily momentum chart with a retest of the previous breakout highs above $42 now confirmed and suggesting a second leg of this remarkable rally, but watch for the inevitable violent inversion:
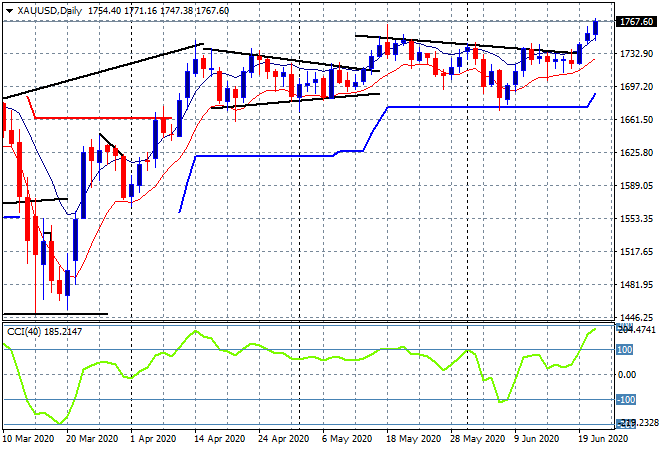
Goooooolllllld! There it goes with a proper breakout, closing well above the $1760USD per ounce level, helped along by the weak USD into a new daily/weekly/monthly/yearly high. This exceeds the previous nominal highs and sets up for further upside, as momentum gets significantly overbought here and ripe for a minor pullback before re-engaging:
Glossary of Acronyms and Technical Analysis Terms:
ATR: Average True Range – measures the degree of price volatility averaged over a time period
ATR Support/Resistance: a ratcheting mechanism that follows price below/above a trend, that if breached shows above average volatility
CCI: Commodity Channel Index: a momentum reading that calculates current price away from the statistical mean or “typical” price to indicate overbought (far above the mean) or oversold (far below the mean)
Low/High Moving Average: rolling mean of prices in this case, the low and high for the day/hour which creates a band around the actual price movement
FOMC: Federal Open Market Committee, monthly meeting of Federal Reserve regarding monetary policy (setting interest rates)
BOJ/Abenomics: Bank of Japan, economic policy/direction enacted by PM Shinzo Abe
DOE: US Department of Energy Uncle Point: or stop loss point, a level at which you’ve clearly been wrong on your position, so cry uncle and get out!