Two different approaches to modelling ASX 200 earnings, with two different answers. We use two different top-down approaches to explain and predict the cycle in ASX 200 real earnings per share (EPS). The first simply correlates market real EPS with economic activity as measured in the national accounts. The second is more sophisticated, exploiting the barbell structure of the ASX 200, and combining the traditional drivers of the major sector profits into an aggregated score for real EPS. Specifically, non-rural commodity prices capture the earnings cycle of resources stocks and related exposures, currency captures translation effects for offshore earners, and the credit impulse captures the earnings cycle of financials and related exposures. Recently, market real EPS as measured on a one-year forward IBES Consensus basis, has fallen by roughly a third. The national income approach has been able to capture this sharp downturn. But the more sophisticated regression model approach has not. Therefore, we have been forced to do some soul searching and reconciliation work.
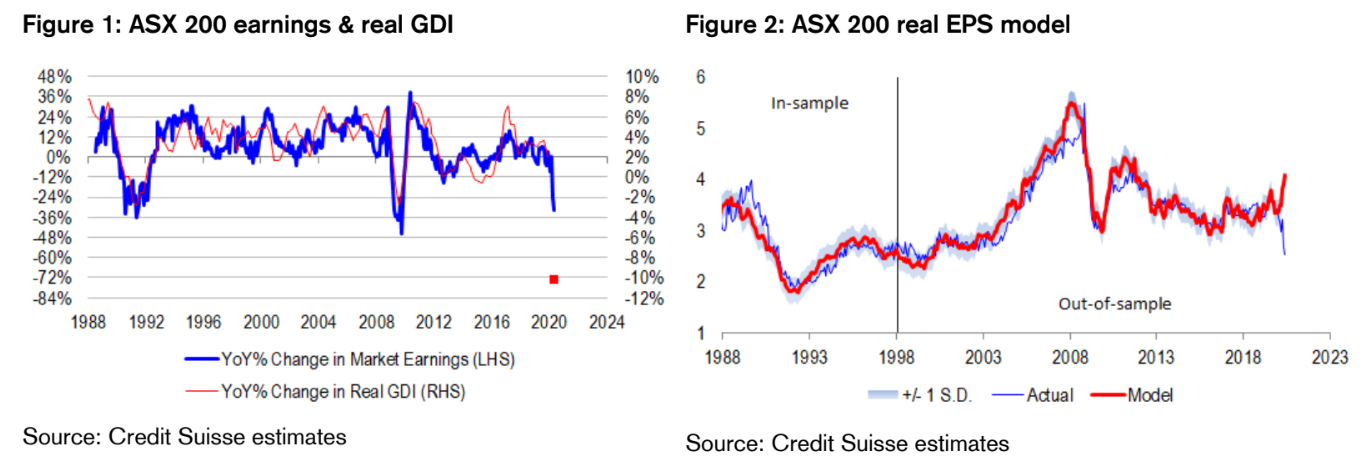
The national income approach. The simplest way of modelling market real EPS is to overlay real GDP. However, this approach has its limitations, because Australia is a small open economy, subject to large income shocks from terms of trade shifts over and above the cycle in production. And profits are more of an income concept than a production concept, meaning that terms of trade shocks really do matter for corporates. Going one step further, we find that real gross domestic income (GDI), a measure of activity that combines real GDP and the terms of trade, correlates extremely well with market real EPS, with a correlation coefficient of almost 75% since the late 1980s. Whenever real GDI growth is above (below) the 2% threshold, market real EPS tends to rise (fall). Every 1% movement in real GDI above (below) trend corresponds with roughly a 6% rise (fall) in market real EPS, with the high EPS beta to GDI reflecting operational and financial leverage of companies in the index. With the RBA forecasting real GDP decline of almost 10% in 1H, and the terms of trade proving quite volatile with commodity prices, we are bracing for a decline in real EPS of almost 72%. That said, we believe that the economy is surpassing RBA growth forecasts in 1H. Certainly, real EPS forecasts are not being downgraded anywhere near as aggressively as what historical relationships and the RBA’s forecasts would suggest. And going forward, if the Bank is right about a “V-shaped” recovery trajectory in real GDP from a low point in 2Q, there should be material upgrades in the offering as well medium term.
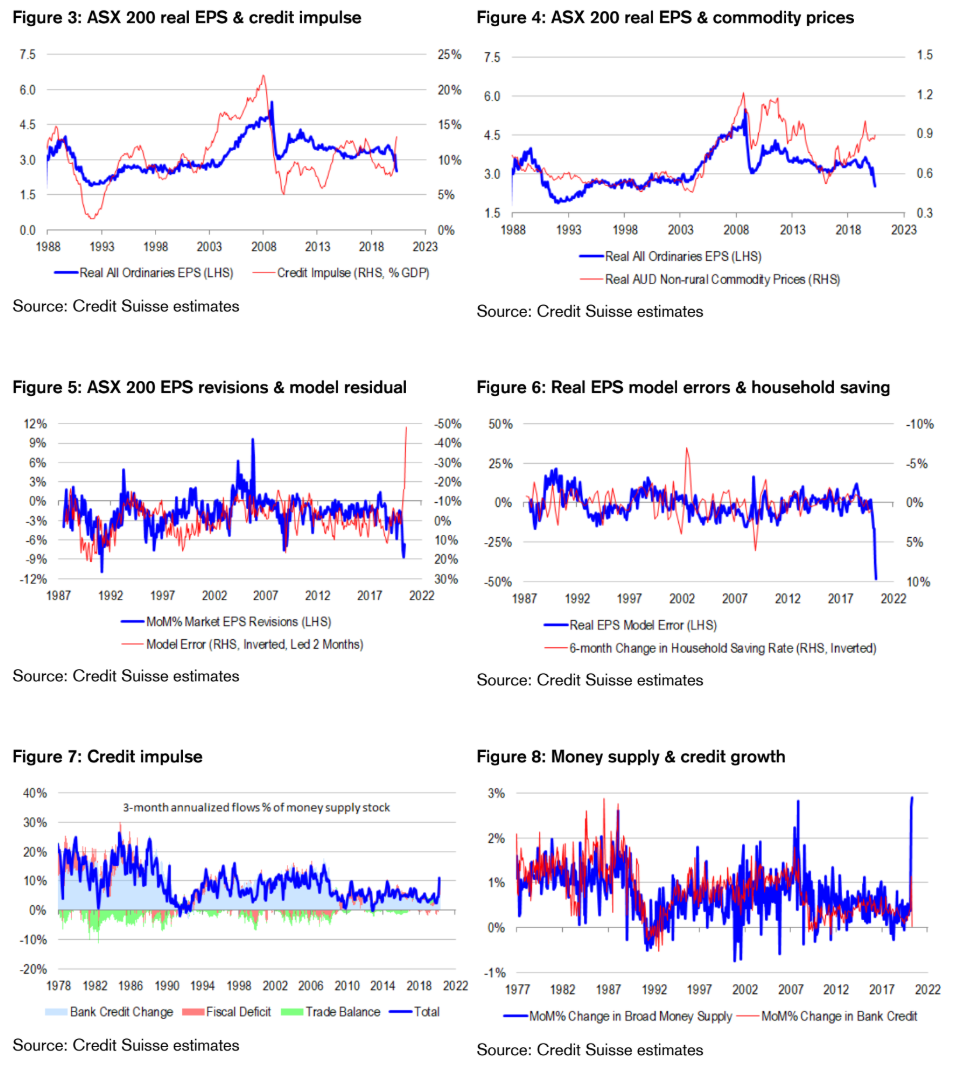
The “Three C’s” model approach. Since the late 1980s, we find that the “Three C’s” – credit growth, commodity prices and currency – are able to explain, if not predict, more than 90% of the variation in real EPS. A 1% increase (fall) in the credit impulse defined across private and public sectors, and expressed as a share of GDP, corresponds with a 2.7% increase (fall) in real EPS. A 1% increase (fall) in AUD-denominated commodity prices corresponds with an 0.6% increase (fall) in real EPS. Importantly, regression model parameters are incredibly stable through time, making the real EPS framework useful for “out-of-sample” forecasting … apparently until now. Recently, we have seen a very sharp pick up in the credit impulse foreshadowing a significant uplift to EPS. The credit impulse has lifted for several reasons. First, non-financial corporates have drawn down upon credit lines during the crisis. Second, owner-occupier principal payments have fallen modestly because of debt holidays granted by the banks. Third, the government has launched extraordinary fiscal stimulus. And fourth, the trade balance has swelled on the back of resources exports, increasing foreign currency denominated saving for the economy. But instead of boosting market real EPS, these developments have gone hand in hand with an extremely sharp fall. Indeed, the discrepancy between actual and model levels of EPS has become so large that if actual levels were to converge upwards to our model forecast, we would expect almost a 50% upgrade! This would not be completely out of the realm of possibility, given the very sharp decline in EPS we have seen recently – but even so, such a recovery would be staggering.
Could this be the end of the line for our earnings model? There are several reasons why our “Three C’s” model might be getting things wrong now – but nevertheless, also reasons to believe in its predictions longer term under the right conditions. In terms of why it is breaking down in the present, the most obvious reason is it is based on a sample history where demand has driven most of the cycle – but this time around, we are seeing both demand and supply shocks. Related to this point, we rarely see credit growth accelerate because of falling repayments, and even when we do, we struggle to view non-repayment as a positive development. But perhaps the most significant source of breakdown is with regards to household saving behaviour. The national accounting identity says that the sum of saving across all sectors must equal zero. More specifically, the sum of household, corporate, government and foreign saving must equal zero. Re-arranging this identity, corporate saving must equal the sum of the fiscal deficit and trade balance minus household saving. What we are seeing now is extraordinary fiscal deficit spending that is technically boosting the credit impulse in our EPS model. However, we suspect that the deficit spending is being saved by households rather than being spent. Indeed, a rise in the saving rate to double digit levels is not out of the question, especially when we consider what happened to the US household saving rate in April! Consequently, fiscal stimulus is not passing on to corporates via the household sector. On the flipside, if and when households choose to dis-save, the risk is that corporate profits rise quite sharply, and we believe that this is what our real EPS model is telling us at present. Interestingly, changes in the household saving rate are negatively correlated with real EPS model errors, consistent with the idea that households are the intermediary for fiscal deficits to transmit to corporate saving.
Positioning for earnings transparency – not necessarily earnings certainty until we get clarity on housing. Ordinarily, we would position our model portfolio for household dis-saving and a sharp cyclical upswing in the EPS cycle, driven by domestics. However, the problem is that we do not yet have clarity about the adequacy of household saving, because saving is a function of housing, job security and debt serviceability, and all of these variables are in states of flux. We are particularly concerned about housing risks, given that border closure will be among the last of the COVID-19 restrictions to be lifted, and that immigration is the lifeblood of household formation in Australia. Until we get more clarity about the housing situation, we prefer to position for earnings transparency. To be clear, by this we do not necessarily mean earnings certainty. We are happy to play a cyclical upswing, provided that we can objectively verify the upswing in company EPS using available macro and market data. We are equally happy with companies offering defensive earnings streams provided they are not crowded trades. But we are concerned about the EPS transparency of financials given such heavy policy intervention in the space. Bigger picture, if the RBA is right about a 10% 1H decline in real GDP, and if analysts need to downgrade real EPS by another 39% (in line with what the national income approach to modelling would suggest), we suspect that most of the pain will need to be worn by financials. After all, we have a pretty good idea in real time what resources company profits are doing because we can observe market commodity prices and weekly export volume data. It is hard to see analysts being severely wrong footed in this complex. We also have comfort about the predictability of earnings for defensive companies because of the very nature of these companies. But we cannot say the same for financials, which incidentally, make up roughly a third of the index.
Profit dynamics are sufficiently different in Australia relative to the US. Regular readers will be aware that we have a rather positive view of US corporate profits and profit margins in the period ahead, because we see overwhelming fiscal stimulus, and reasonable prospects for households to run down their saving from extraordinarily high levels to transmit this stimulus to corporates. We are also hawkish on inflation because we see declining productivity with a temporary period of pricing power for firms. Why then can we not apply the same logic and conclusions to Australia? In the first place, it is abundantly clear to us that the US household saving rate is more like to fall than rise in the period ahead, given that it is at an all time historical high of 33%. But in Australia, we lack timely data on the saving rate. More fundamentally, the key points of distinction between the US and Australia are with regards to the size and longevity of fiscal stimulus. In the US, the government is implementing stimulus packages reportedly worth $9 trillion, or 42% of GDP. To date, it is less than a quarter of the way through its spending plans. But in Australia, the government is implementing stimulus packages worth “only” $153.6 billion, or 7.6% of GDP after recently sharp downward revisions to estimates of the “Job Keeper” program. Moreover, as of early June, the government is already a third of the way through its spending plans. The risk in both the US and Australia is that private sector credit impulses fade very quickly after the initial goodwill phase from banks and policy makers ends. If and when this occurs, it is imperative that fiscal policy fills in the void. In the US, there is little evidence that bank credit growth is materially slowing heading into June – but in Australia, the evidence is quite clear that credit growth is slowing sharply. And considering the relatively limited nature of fiscal stimulus to come, we could see quite significant volatility in the overall Australian credit impulse in the coming months. From a portfolio construction perspective, we want to avoid this volatility and uncertainty until we have more visibility on the policy response. On the flipside, we want to capture the reflation potential from the US and global cycles. Therefore, we are underweight financials relative to resources stocks within the ASX 200.
If I may say so, a profits model based upon credit growth and commodity prices is at this stage broken owing to:
The full text of this article is available to MacroBusiness subscribers
David Llewellyn-Smith is Chief Strategist at the MB Fund and MB Super. David is the founding publisher and editor of MacroBusiness and was the founding publisher and global economy editor of The Diplomat, the Asia Pacific’s leading geo-politics and economics portal.
He is also a former gold trader and economic commentator at The Sydney Morning Herald, The Age, the ABC and Business Spectator. He is the co-author of The Great Crash of 2008 with Ross Garnaut and was the editor of the second Garnaut Climate Change Review.