CBA’s head of Australian Economics, Gareth Aird, has released new forecasts for the Australian economy, which estimates that GDP will contract by 3.2% in 2020 and will not return to its pre-COVID level until 2022:
Key Points:
There are green shoots emerging in the Australian economic data, as the unprecedented level of fiscal and monetary policy stimulus supports an economic recovery.
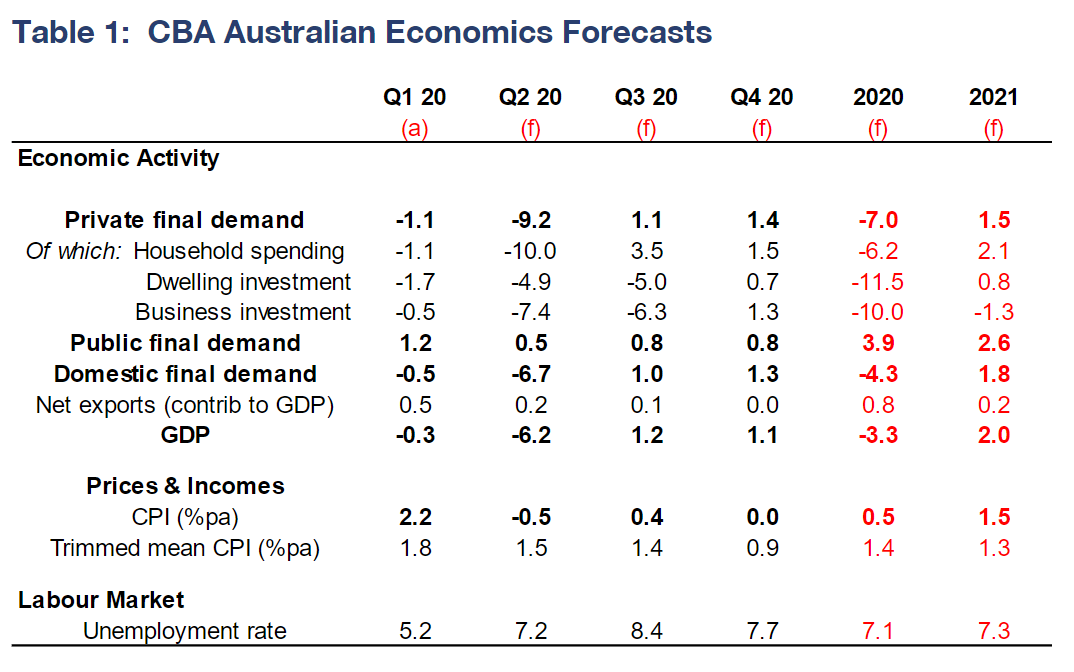
We have revised up our GDP profile and now expect a contraction of 3.2% in 2020 (versus 4.2% previously) and an increase in GDP of 2.0% in 2021.
The official unemployment rate will continue to rise, but our data on JobSeeker payments indicates that ‘true’ unemployment peaked in late May and is now falling.
Overview:
It is an understatement to say that the Australian economy is in the midst of an extraordinary set of circumstances.
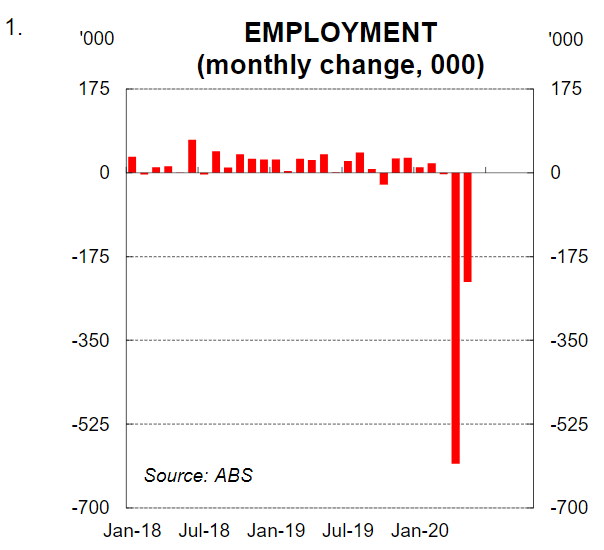
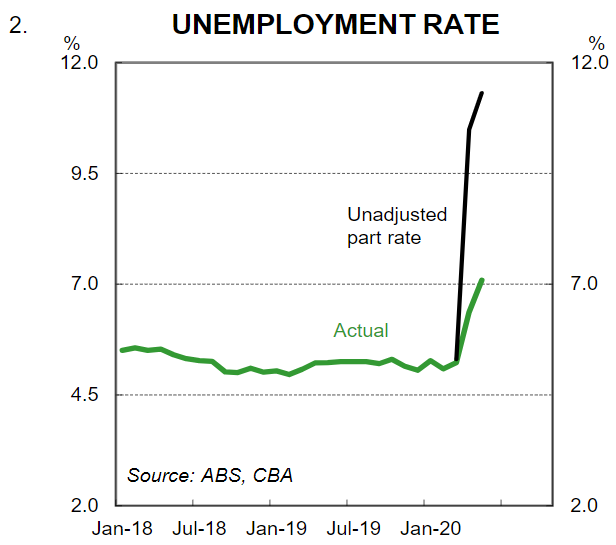
The policy decision to shut down entire parts of the economy to limit the spread of COVID-19 has had profound economic consequences. The labour market statistics are particularly telling. The combined fall in the number of people employed was 835k over April and May (chart 1). The unemployment rate would have been 11.3% in May if all of the workers who lost their job were considered unemployed (chart 2).
It is easy to focus on the negatives when such terrible economic data is published. But rather than dwell on what has happened we are most interested in where the economy is headed. A lot of the more recent official economic data is simply an accounting exercise of what took place during the worst of the slump in activity when government imposed restrictions were at their most stringent.
As the economy is reopened it is clear to us that we are past the low point in economic activity. Indeed the pace of recovery in spending is occurring faster than was initially anticipated. And true unemployment based on our internal data on JobSeeker payments is already falling. In this note we identify seven green shoots in the data that signal the economy can recover faster than previously anticipated. To be clear, there is a lot of uncertainty around the outlook and an elevated level of unemployment will be with us for an extended period of time. But in our view the outlook has improved and it warrants an upgrade to our economic forecasts.
(i) Latest news on COVID-19
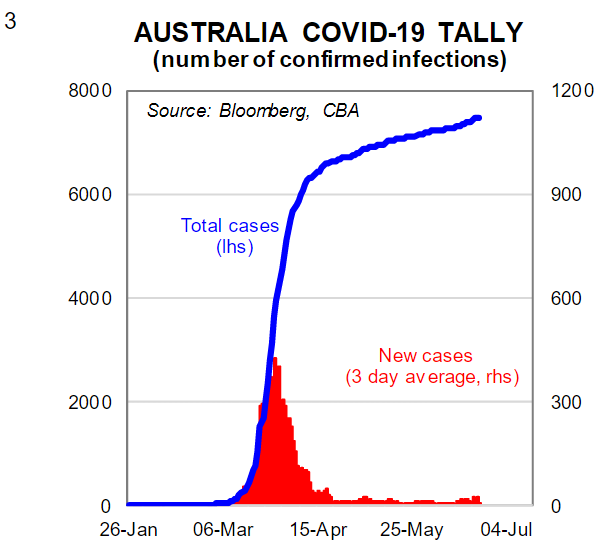
The most logical place to start is news on COVID-19 itself. The massive contraction in economic activity and employment was a result of the COVID-19 pandemic so understanding what is happening on the virus front is critical to assessing the economic outlook. The news in Australia is overwhelmingly positive. The transmission of COVID-19 in Australia is low, particularly community transmission.
There are still pockets of outbreaks, particularly in Victoria at the moment, but these are low in the scheme of things. The virus has not been eradicated so outbreaks will occur. But in the main Australia has done very well in containing the spread of COVID-19. This has facilitated an earlier than expected reopening of large parts of the economy and an easing in social distancing requirements. This clearly has a positive impact on economic activity.
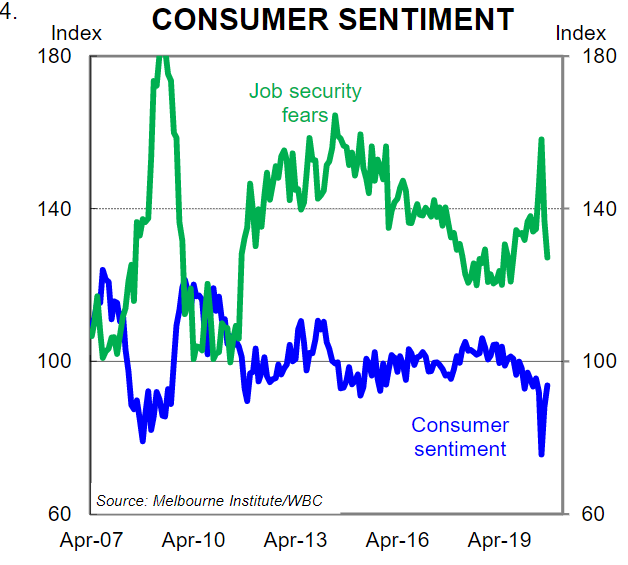
(ii) Consumer confidence is back to pre-COVID-19 levels
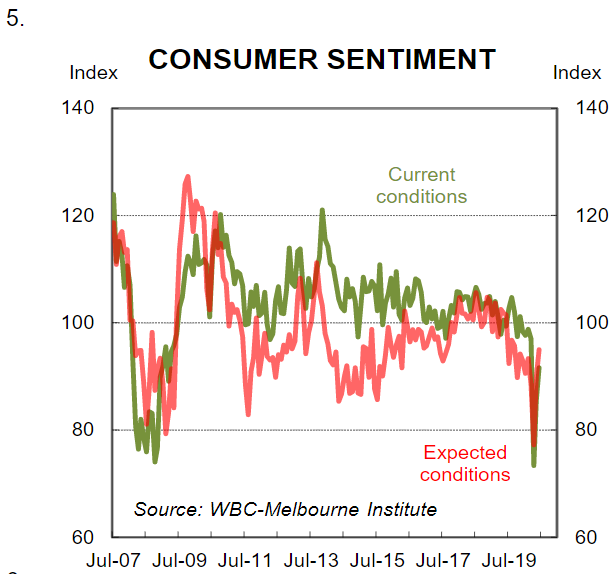
The household perception of the economy is a key driver around consumer decisions to spend or save. Confident consumers are more likely to spend income, while cautious consumers are more likely to save it. The changes around consumer confidence have been nothing short of remarkable over a three month period.
According to the WBC/Melbourne Institute monthly consumer sentiment report there has been a huge rebound in consumer confidence over the past two months (charts 4 & 5).
Confidence dropped by 20% in April when concerns around the pandemic were most acute. But confidence staged a remarkable turnaround in May and June. Somewhat paradoxically, consumer confidence has rebounded back to pre-COVID-19 levels. To be fair, the headline index was tracking below its long run average at a historically weak level pre-COVID-19. Notwithstanding, it’s been an incredible turnaround considering everything that has happened over the period. There has also been a significant fall in job security fears over the past few months despite the big fall in employment.
The lift in consumer confidence and fall in job security fears is very important because it indicates the intangibles are moving in the right direction. If consumer sentiment remained in the doldrums we would not expect to see a rebound in spending and savings would remain elevated. On the other hand, the lift in consumer sentiment to pre-COVID levels is consistent with a greater willingness to spend and that is being captured in our CBA credit and debit card data.
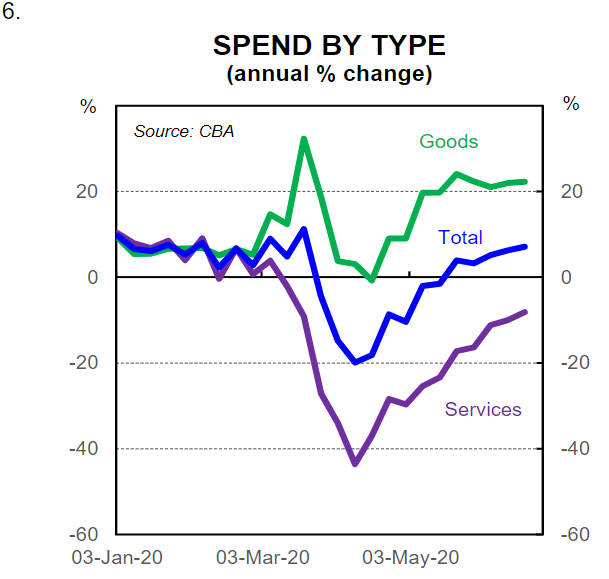
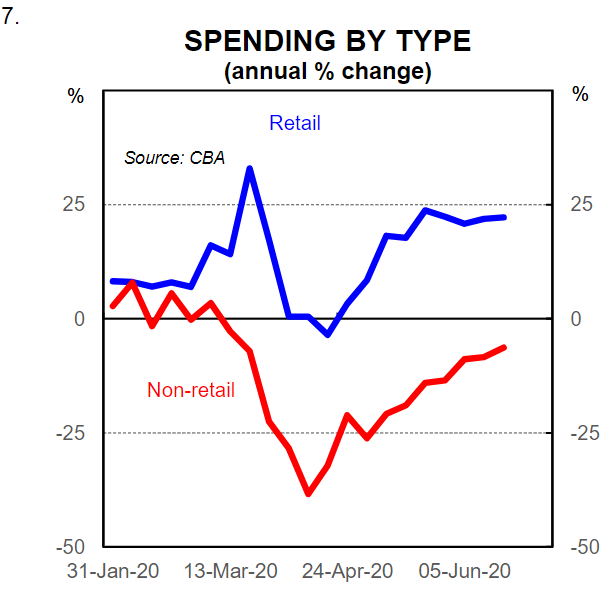
(iii) Spending has picked up faster than anticipated
The latest official data on spending is the May retail trade report (prelim). According to the ABS, retail trade surged by 16.3% in May following a 17.7% plunge in April. The strength of the May report didn’t surprise us. The data simply rubber stamped what our internal data from CBA credit and debit card spend had already indicated. Namely, that spending has lifted as the economy has been reopened.
Our latest data captures household credit and debit card spend to the week ending 19 June. Spending has continued to improve over June albeit the pace of improvement has moderated (see here). Spending on services has driven the recovery. Our data indicates that total card spend to the week ending 19 June is up by 7% compared to a year ago (charts 6 & 7). On the surface, this figure sounds too high. But that is because there has been a shift from cash to card spend which has augmented the overall level of card spend. There is both a pre-COVID and post-COVID impact.
We have modelled that impact and estimate that the cash to card switch from COVID-19 is worth around 6% of total spend(the COVID impact is basically businesses and households not wanting to physically handle cash). There was a shift taking place pre-COVID from cash to card given the increased use of PayWave which we estimate is worth around 4%. Therefore we estimate that true breakeven is now about 10%/yr up on our internal card data. In other words, our latest card data which puts spend at 7%/yr implies that overall spending is down 3% on year ago levels. Thatis still a huge turnaround from where we were two months ago.
We remain in the early stages of the recovery, but our card spend data overlaid with consumer sentiment data indicates that a positive feedback loop is slowly evolving between confidence and spending. The big lift in household income due to fiscal stimulus is playing an important role.
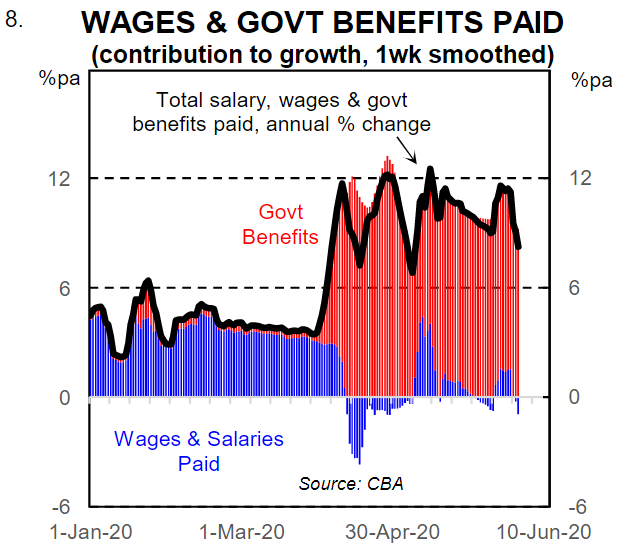
(iv) The positive shock to household income continues
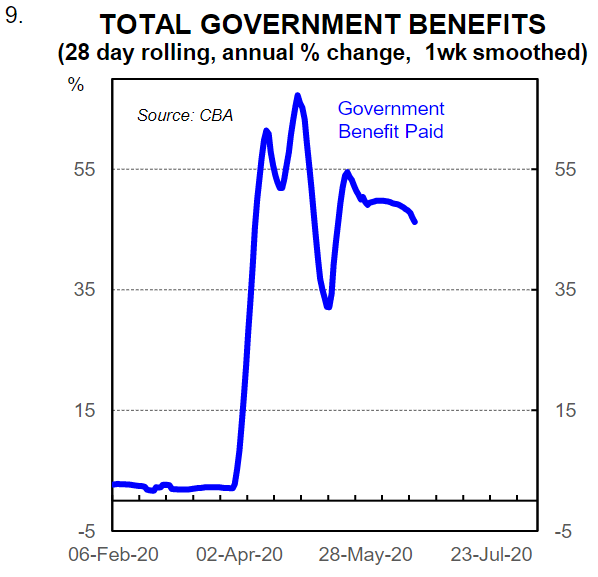
Updated analysis from payments into CBA bank accounts indicates that the reduction in household income from job losses to date continues to be more than offset by an increase in government benefit payments (chart 8). The annual growth rate in our partial read on household income that comprises wages and salaries paid plus government benefits paid sits around twice its pre-COVID-19 level (latest data to 19 June).
Whilst week to week the data is volatile, the trend is clear. The big contraction in spending over Q2 20 sits completely at odds with the dynamics at play on the income side. Fiscal stimulus reconciles the difference.
The size of the fiscal stimulus means that there has been a positive shock to household income as a result of the COVID-19 pandemic. Government benefit payments have surged (chart 9). And there is more coming in the near term. The second tranche of $A750 payments to social security, veteran and other income support recipients will be paid from 13 July 2020.
The fiscal support to households means that household income should remain in good shape until late-September/October. The key question then is around what happens to income when JobKeeper comes to an end and the JobSeeker payment is due to return to its pre-COVID-19 level.
The Government has some flexibility around unwinding the COVID-19 induced fiscal stimulus in part due to the estimated cost of JobKeeper falling from $A130bn to $A70bn. It may be that the Government now takes a ‘taper-type’ approach to winding back the stimulus. Indeed that it what we consider to be the most likely scenario. Given that we expect the unemployment rate to be around 7¾% in Q4 20, it is clear that many Australians will still require income support beyond September.
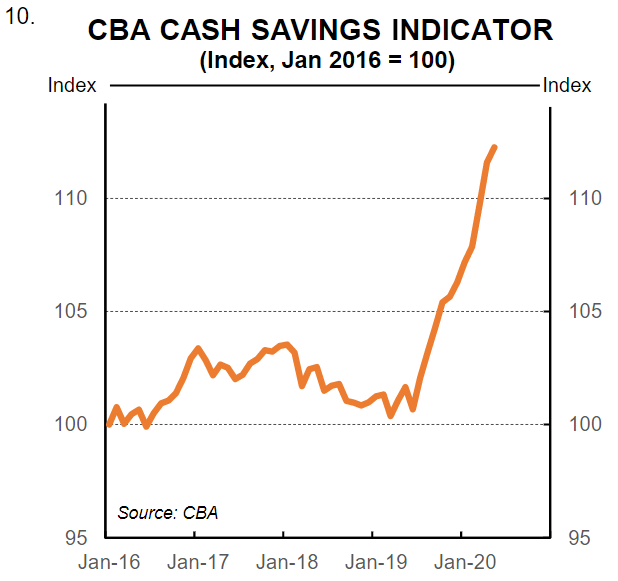
(v) Household savings are high
The positive shock to household income at a time when spending dropped sharply because of the shutdown has resulted in a spike in savings. Our CBA cash savings indicator, which is based on the average total savings balance per household, including home lending related savings and transaction or savings accounts, has surged over the past four months (chart 10).
In many ways the increase in savings has been forced upon households as it was not possible to consume many goods and services during the shutdown. Eating in, for example, is cheaper than eating out. So as households bunkered down and activity was restricted savings lifted. The early withdrawal of superannuation has also played a part.
Now of course we do not know if households will spend the additional savings. And there will be many people who have lost their job and will not want to spend any additional savings due to uncertainty around when they will be rehired. But the starting point is certainly a good one because at least the savings have been accumulated over the past few months. The lift in consumer confidence at the very least increases the proportion oftotal savings that willlikelybe spent.
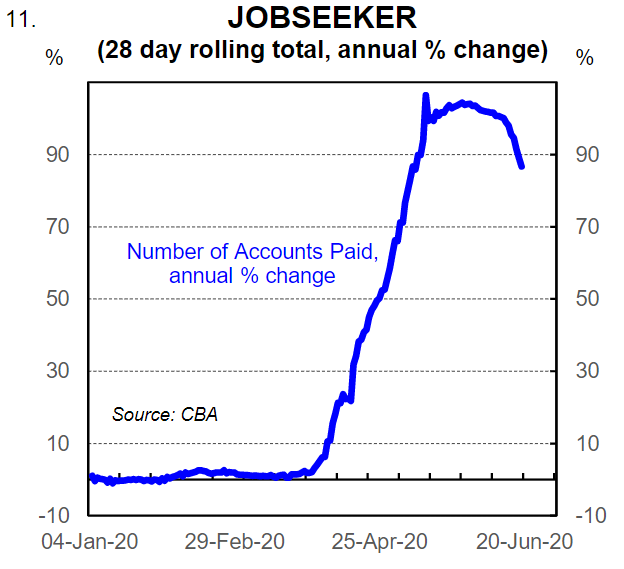
(vi) The number of people receiving JobSeeker is declining
Our near real time data on the number of CBA bank accounts receiving JobSeeker (i.e. unemployment benefits) suggests that the labour market is currently improving. The early indication from our data is that the number of CBA bank accounts receiving JobSeeker peaked in late May. There has been a decline since then (chart 11).
The official labour market statistics over coming months will indicate that the unemployment rate is rising. But ‘true’ unemployment is falling. A decline in the number of people receiving JobSeeker signals to us a fall in the number of people unemployed. But from an ABS standpoint things will be reported differently.
The path of the official unemployment rate from here will reflect not just changes in the level of employment but also the movement in labour force participation. We expect the participation rate to rise as workers who have lost their jobs start the search for a new job. It is important to focus on hours worked and changes in the level of employment and the participation rather than relying on the official unemployment rate as a barometer of the jobless rate in Australia. From our perspective, our data on JobSeeker will give us a near real time pulse on the speed at which the labour market is tightening.
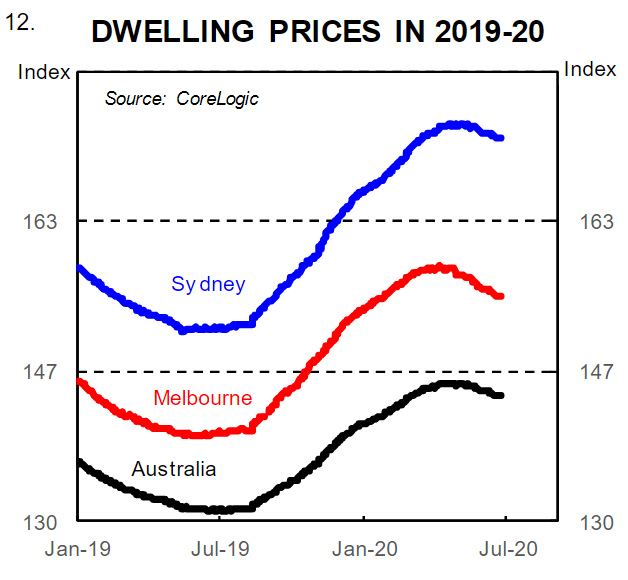
(vii) House prices have not fallen much
The extent to which house prices and the housing market more generally have held up so far has surprised to the upside. According to CoreLogic, dwelling prices nationally are down just ~1% over the past few months (chart 12).
Our expectation has been that dwelling prices nationally would fall by around 10% as a result of the COVID-19 pandemic. The increase in unemployment, falling rents and lower net overseas migration were the primary reasons behind our forecast. But in our detailed note of 17 April we pointed out that there were clear upside risks to our forecasts.
Specifically we wrote, “there are both downside and upside risks to our dwelling price forecasts. The risks both hinge on the length of the enforced shutdown and restrictions placed on economic activity. In a best case scenario government restrictions on economic activity could start to be lifted by the end of May. For that to occur, it would probably take several days of zero or very low community transmission of new COVID-19 cases. That is a possible scenario given the current trend in new COVID-19 cases. If that were to occur the plunge in economic activity that we expect would not be as large and the impact on the property market would not be as severe. Indeed the fall in property prices would be significantly smaller than our central scenario, particularly given the extraordinary low borrowing rates currently on offer.”
That upside risk has materialised. The upshot is that dwelling prices have not fallen all that much so far, which means that there is no material negative wealth effect to date coming via house prices. That is very important for the outlook for household consumption and consumer sentiment as falling property prices weigh on overall expenditure.
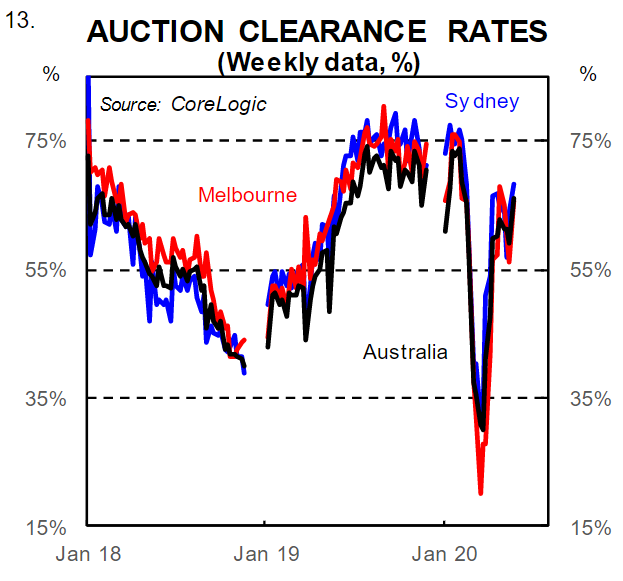
Whilst property prices are still likely ease over coming months, it looks more likely that the falls will be more modest than initially anticipated. Auction clearance rates have rebounded to reasonable levels and it looks like the impact of significantly lower mortgage rates is largely offsetting the other forces weighing on dwelling prices (chart 13).
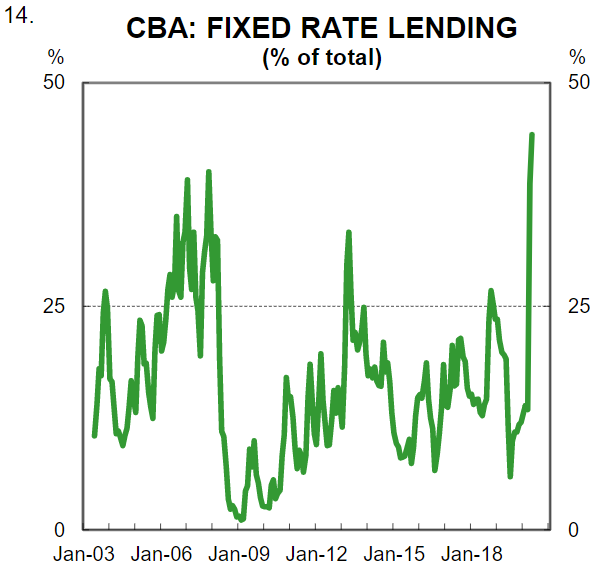
Lower mortgage rates are also having a positive impact on household disposable income. The share of CBA’s fixed rate lending rose sharply in April and May following the announcement of a reduction in CBA’s fixed term lending rates in March (chart 14).
Lower mortgage repayments for households frees up money that can be spent on goods and services. Updated forecasts We have updated our forecasts for the Australian economy to take into account the earlier than expected reopening of the economy, the faster than anticipated rebound in consumer spending and the material improvement in consumer confidence. There are clearly a lot of downside risks to the outlook, particularly around net overseas migration and the roll off of various stimulus measures (though we expect some policy changes on that front that will mean the Government takes a taper type approach). But some previously identified upside risks have materialised.
In summary, the landscape is evolving very quickly and things have moved in a better direction than looked likely earlier in the June quarter. Our internal data leads us to conclude that the contraction in Q2 20 GDP will not be as large as previously expected. We now expect a contraction in GDP over Q2 20 of 6.2% (versus our previous forecast of -8.2%).
The revision raises the profile of our GDP forecast for 2020, albeit that some of the recovery in household consumption previously pencilled in for Q3 20 is pulled forward to the June quarter.
The overall impact is that we now expect a smaller contraction in GDP of 3.2% in 2020 (versus our previous estimate of 4.2%).
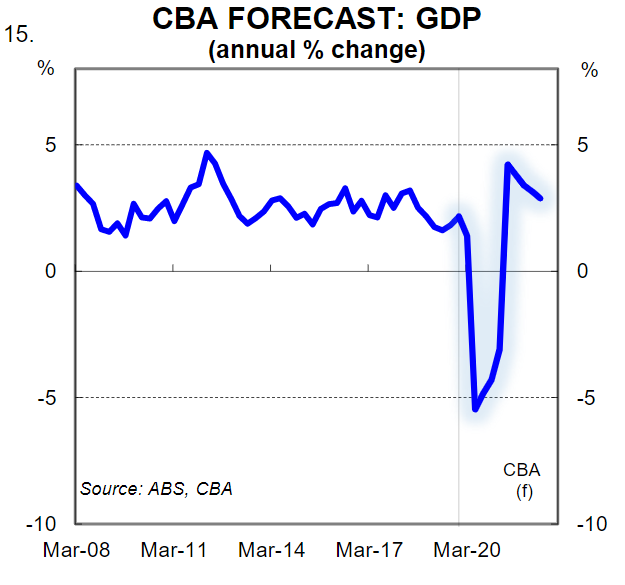
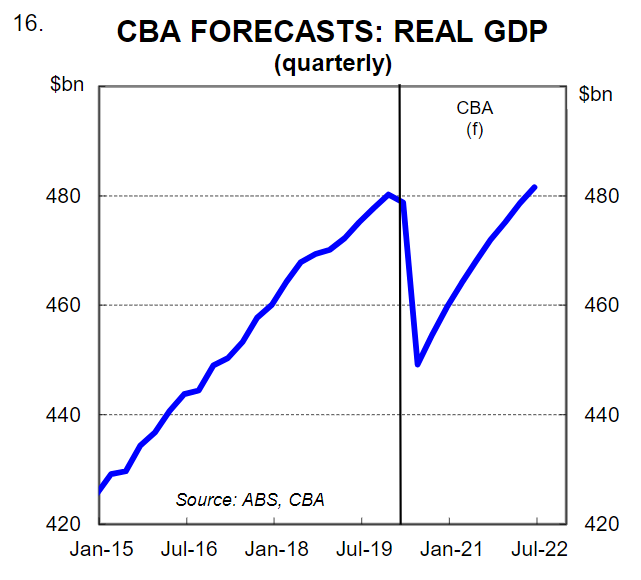
Our forecast for GDP growth in 2021 has been lowered to 2.0% (versus our previous estimate of 3.2%). But it is important to note that the level of GDP that we expect in 2021 is now higher given we do not expect as deep a contraction in 2020. Importantly, despite our upgrades, the overall level of GDP is not anticipated to return to pre-COVID-19 levels until Q1 2022 (chart 16).
Table 1 below contains our updated quarterly profile for GDP, employment, unemployment and inflation.
Monetary policy implications
Our updated forecasts for the economy do not have any implications for our monetary policy call over our forecast horizon. Monetary policy will remain highly accommodative over the next few years.
Even as the economy improves there will be a large output gap. This means that there will be a significant amount of slack in the economy that will need to be eroded before monetary policy is tightened. Full employment and underlying inflation within the 2%-3% target band looks a very long way off. As such, we expect the cash rate to sit at 0.25% over our forecast horizon (to mid-2022).
The 3 year ACGB bond yield target is likely to remain in play over that time, but there is a risk that the RBA either increases the target or removes it in 2022. For as long as the 3 year ACGB sits at the same level as the cash rate the RBA is implying that the cash rate will remain on hold for the next three years.
At some point they may wish to signal to the market that their intention is not to leave the cash rate on hold at 0.25% for a further three years. They could do this by either removing the target or increasing the target yield. It’s certainly not a concern for financial markets at the moment, but it is worth thinking about when considering the medium term outlook for monetary policy in Australia.
Leith van Onselen is Chief Economist at the MB Fund and MB Super. He is also a co-founder of MacroBusiness.
Leith has previously worked at the Australian Treasury, Victorian Treasury and Goldman Sachs.